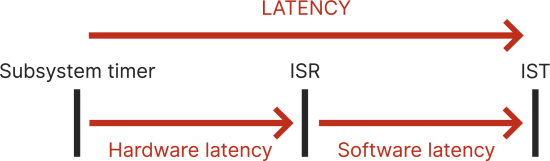
System Timer Response Latency is measured as the total time from when a kernel timer interrupt sends a signal to when that signal is recognized by software running in an Interrupt Service Thread (IST). As shown in the diagram below, Latency is made up of Hardware latency, the time it takes for a signal to be recognized by an Interrupt Service Routine (ISR), and Software latency, the time it takes from ISR to the routine running in IST.
eRTOS provides a utility called System Response Time Measurement (SRTM), a real-time API timer latency measurement tool that measures timer latency observed by the application. An SRTM histogram often shows a characteristic double peak profile: the first peak is a near-best case; the second is the dirty-cache case. The diagram occasionally shows additional smaller spikes from processor-level interrupt masking.
To measure timer latency, type the following into a command prompt:
Run "C:\Program Files\IntervalZero\MaxRT\eRTOS\bin\srtm.ertos" [-h][-f] seconds_to_sample
In this section: