The following steps will demonstrate a simple Visual Studio debug session, when the application uses an RTDLL. An RTDLL is a real-time dynamic linked library, similar to a Windows DLL, so it can be debugged within the Visual Studio instance that is debugging your application.
To debug an RTX application and an RTDLL, do the following:
In this tutorial, we will use Visual Studio 2015.
Make a copy and open the solution:
Program Files\IntervalZero\RTX SDK\Samples, if you installed them to the default location.RtxApp_wRTDLL_VS2015, and click OK.SampleRTDLL_VS2015 project that will create an RTDLL. When you open it you will see it contains a single source file, SampleRtdll.c.UsingRTDLL_VS2015 project that will create an application which uses the RTDLL. When you open it you will see it contains a single source file, UsingRTDLL.c.Open the application that will use the RTDLL:
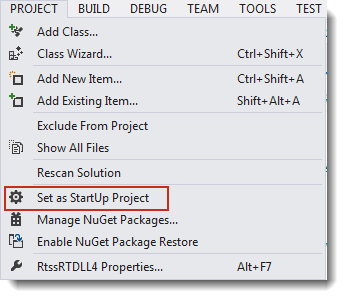
The program that will use the DLL should start when debugging begins. To ensure this, right-click on the UsingRTDLL_VS2015 project from the Solutions Explorer window and selecting Set as StartUp Project from the pull-down menu.
Steps:
The solution directory will now have executable files for each of the projects in the subdirectory \bin\RTSSDebug.
/d.NOTE: Hard-coded and Data breakpoints are not supported.
Steps:
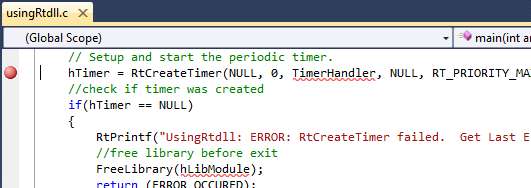
UsingRTDLL.c by double-clicking in the column to the left of the RtCreateTimer function call or by right-clicking on the line and clicking Breakpoint > Insert Breakpoint in the pop-up menu.
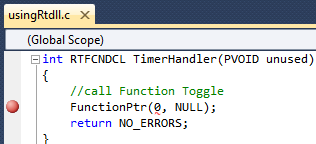
UsingRTDLL.c by double-clicking in the column to the left of the call to function toggle (pointed to by FunctionPtr). This function is located in the RTDLL.

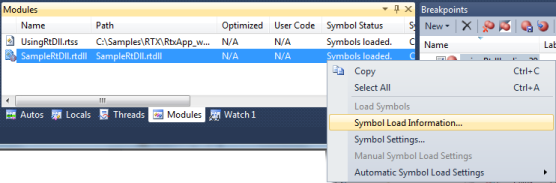
NOTE: If Modules is not available from the status bar, select Modules from the Windows option in the Debug pull-down menu to open the modules window.
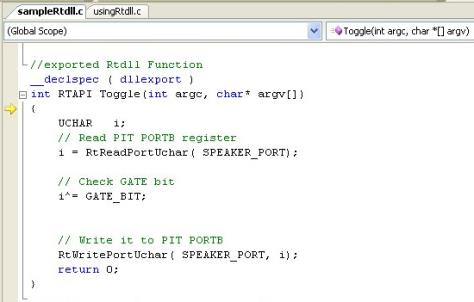
Focus will now turn to the SampleRTDLL.c source code.
When focus returns to the SampleRTDLL.c program, you can select to Continue or to Stop Debugging from the Debug pull-down menu. If you select Continue, program execution will continue until it completes or reaches another breakpoint. If you select Stop, program execution will halt.