Debugging a RTSS Application with Visual Studio

The following steps will demonstrate a simple Visual Studio debug session, using one of the provided RTX sample programs. Follow along to:

Start Visual Studio

In this tutorial, we will use Visual Studio 2015.

Steps:

  1. Make a copy of the SRTM sample in a location where you have read/write permissions. The IntervalZero Samples are located under Program files\IntervalZero\RTX SDK\samples, if you installed them to the default location.
  2. To begin, start Microsoft Visual Studio.
  3. Open an existing project by clicking File > Open > Project
  4. Browse to the copy of the SRTM sample you created, and then select the solution SRTM_VS2015 and click OK.
  1. The SRTM solution will open. The project called SRTM_VS2015 contains a single source file, Srtm.c.

Build the Project

When a project like SRTM is generated using the RTX Application template, it contains a solution with four configurations to build Windows executable files with and without debug symbols (Debug / Release) and RTSS executable files with and without debug symbols (RTSSDebug / RTSSRelease). These solution configurations can be seen in the pull-down menu.

Steps:

  1. To build an RTSS configuration that can be debugged, select the RTSSDebug configuration.
  2. From the Build menu select Rebuild Solution.

Build output will display in the Output window at the bottom of the screen. If the output window is not visible, select Output from the View pull-down menu.

       ------ Build started: Project: SRTM_VS2015, Configuration: RTSSDebug Win32 ------
	Srtm.c
	SRTM_VS2015.vcxproj -> C:\Samples\srtm\VS2015\RTSSDebug\Srtm.rtss
	StampTool: Successfully stamped file 'C:\Samples\srtm\VS2015\RTSSDebug\Srtm.rtss'!
	========== Build: 1 succeeded, 0 failed, 0 up-to-date, 0 skipped ==========


Debug

NOTE:  Hard-coded and Data breakpoints are not supported.

Steps:

  1. From the Solution Explorer window, open the source file 
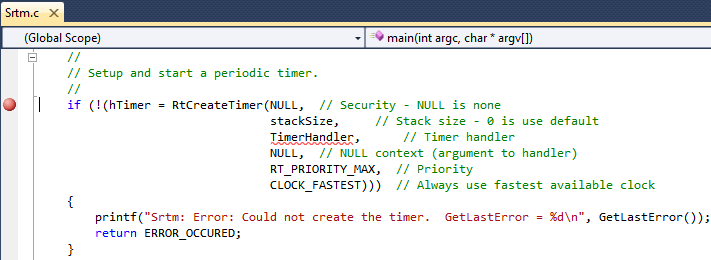
SRTM.c by right-clicking the file name and selecting Open, or by double-clicking the file name.
  2. Set the first breakpoint by double-clicking in the column to the left of the RtCreateTimer function call, or by right-clicking on the line and clicking Breakpoint > Insert Breakpoint in the pop-up menu.

  1. Set a second breakpoint by double-clicking in the column to the left of the 
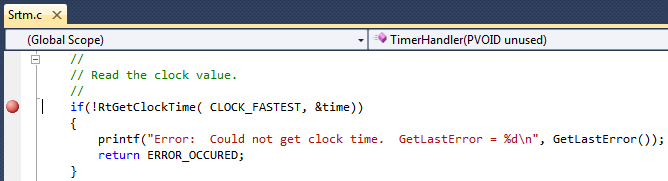
RtGetClockTime function call.

  1. To start debugging, select Start Debugging from the Debug pull-down menu, or press the F5 key.

  1. The RTX Server console window will open and display text from the program and then the debugger will stop the program at the first breakpoint.
  2. To continue from the breakpoint, select Continue from the Debug pull-down menu or press the F5 key.
  3. When the debugger stops at the second breakpoint, view variable values in the Autos window. If the debug windows are not visible, use the Windows option in the Debug pull-down menu to display them. Press the F5 key to continue debugging.
  4. While debugging, you can select to Continue or to Stop Debugging from the Debug pull-down menu.  If you select Continue, program execution will continue until it completes or reaches another breakpoint. If you select Stop, program execution will halt.

After you have finished the debug session, you can close the RTX Server console window.

Related Topics:

MiniTutorials: