|
|
This topic describes some useful ways to use ObjectViewer for diagnosing your RTSS applications and RTDLLs.
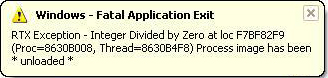
Fatal errors include process and thread addresses in the error message. You can record these addresses, then look at the Address column in ObjectViewer to determine which process or thread has caused the error.
NOTE: To see the Address column, turn Compact Style view off.
You can use ObjectViewer to determine if memory leaks exist. If, after theoretically cleaning up all memory for a thread, you still see in ObjectViewer that memory has been allocated to the thread, you know you have a memory leak.
Threads whose stack usage exceeds their stack size can cause blue or green screens to occur. You can use ObjectViewer to view both stack usage and stack size information to determine if problematic threads exists.
In instances where a shared memory object already exists, calling RtCreateSharedMemory behaves as an RtOpenSharedMemory call instead. This can cause confusion because you may think you have created a shared memory object with a certain size but instead you opened an existing shared memory object with its own previously defined size. ObjectViewer reports the base address and size of any shared memory objects, so you can determine if a shared memory object has the size you think it should.
NOTE: For additional information about RtCreateSharedMemory and RtOpenSharedMemory, see the RTX SDK documentation.
To view who owns a mutex, select the mutex in tree view, then scroll to the right to view the Owner/Handler column.
In ObjectViewer, you can see who is using an RTDLL (the Owner/Handler column) and also the number of functions the RTDLL is exporting (Exported Functions column). This information can help you determine if there is a discrepancy between the number of functions the RTDLL is supposed to export and the number of function it is actually exporting.
To determine what interval a timer is using, select the timer in tree view, then scroll to the right to view the Interval column. To determine what clock your timer is based, scroll to the State column.
