|
|
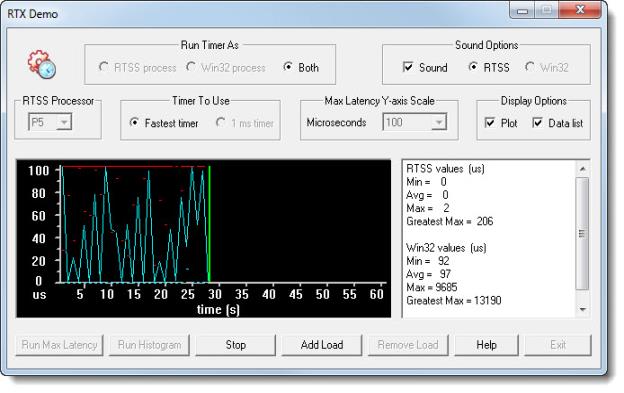
The x-axis shows time in seconds. The y-axis is the response time latency in microseconds. The solid line plots the maximum latency value in microseconds during a one-second interval. The dashed line plots the average latency value.
The data area records the minimum, average, and maximum latencies for the interval. It also shows the greatest maximum value over the course of the data retrieval (from clicking on the Run Max Latency button until clicking on the Stop button). RTSS latency values are shown in cyan, Win32 values in red. When Win32 values are too high, they are plotted at the upper boundary of the window.
