|
|
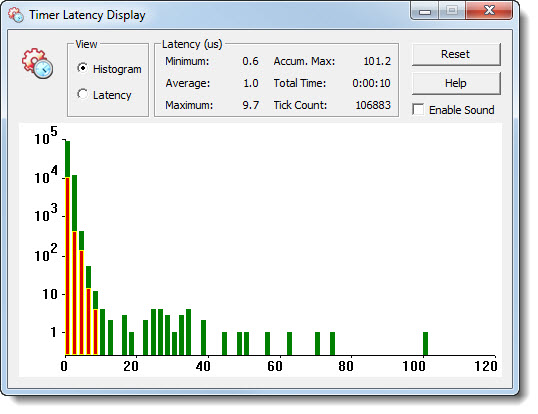
The horizontal axis represents the time difference between scheduled
and observed time, in microsecond units. The vertical axis represents
a count of the number of times this difference is observed to fall within
a particular range, or 'bin.' Counts are displayed on a logarithmic axis.
The histogram bin size is adjusted automatically to ensure that the highest
observed latency value is visible on the graph.
