Open topic with navigation
Plotting Options
RTX Platform Evaluator lets you specify what you want to view for each environment.
The Charts menu contains the following commands for customizing how the
data is displayed.
The following commands are on the Charts menu.
- Histogram
and Strip — Shows/hides the charts.
- Win32
and RTSS Options — Allows you
to change the data that is plotted on the active charts.
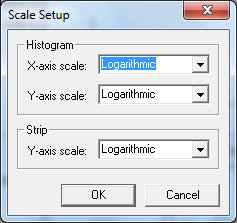
- Axis Setting
— Opens a dialog box where you can specify the axis type (Logarithmic
or Linear) to use in the charts.
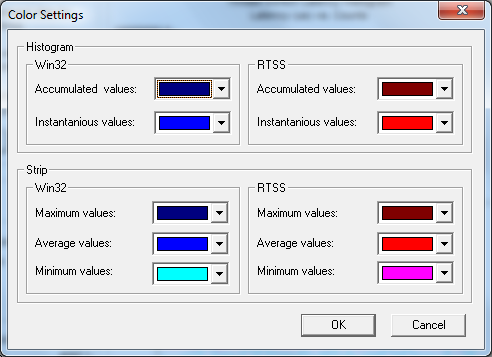
- Color Settings
— Opens a dialog box where you specify the colors used in charts.