Actor Instance Graphs
The Actor Instance Graphs (Views > Actor Instance Graphs) display timing properties of actor instances. Each data point in the graph represents a specific actor instance, where the x-axis shows the instance start time and the y-axis the property value.
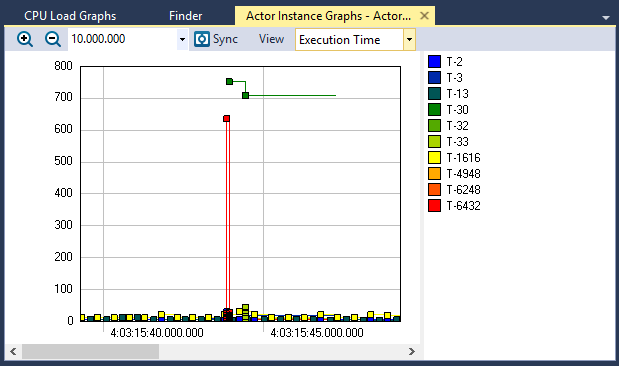
This view can be used to identify long-running threads using the execution and response time graphs, or potential scheduling problems using the fragmentation and interference graphs.
You can plot these properties:
- Execution Time – the amount of CPU time used by an Actor Instance, excluding pre-emptions.
- Response Time – the time from the start of an actor instance until it finishes. The response time for threads is counted from the start of execution of the actor instance. For Interrupt Service Routines, the Response Time is counted from start of execution.
- Wait Time – this is Response Time minus Execution Time, i.e., the time within an instance when the actor is not executing.
- Response Interference – the relation between execution time and response time. A value of 30% means that the response time is 30% longer than the execution time, i.e., due to preempting threads, interrupts or blocking. A value of 0% means that the response time is equal to the execution time, i.e., that the actor instance executed to completion without context switches.
- Fragmentation – the number of fragments within an Actor Instance, i.e., due to context switching. If an Actor Instance executes in full without pre-emptions, the fragmentation of the instance is 1.
- Separation – the time between the instance start time and the previous instance finish.
- Periodicity – the time between the instance start time and the previous instance start time.
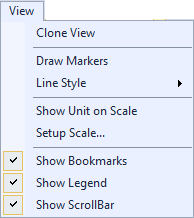
View Options
The View menu contains several options that allow you to change the graph’s display and content.
| Menu | Option | Description |
|---|---|---|
|
Clone View |
Creates a duplicate copy of the view in the same window. |
| Draw Markers |
Toggles display of markers. |
|
| Line Style |
Choose a line style for the graph to display:
|
|
| Show Unit on Scale |
Toggles display of the units of measurement. |
|
| Setup Scale |
Opens the Setup Scale dialog, through which you can choose an automatic (default) or manual scale. |
|
| Show Bookmarks |
Toggles display of bookmarks |
|
| Show Legend |
Toggles display of the color legend. |
|
| Show ScrollBar |
Toggles display of the scrollbar. |
Related Topics ABOUT TRACEALYZER:
- About Tracealyzer
- Terminology
- Understanding the Tracealyzer User Interface
- Configuring Tracealyzer
- Tips, Tricks, and Notes
rELATED tOPICS ABOUT MONITORING:
