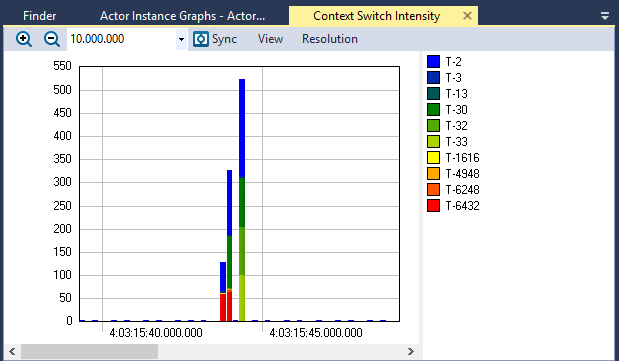
Context Switch Intensity
The Context Switch Intensity graph (Views > Context Switch Intensity) shows the amount of context switches over time. For each time interval, a bar is drawn for each actor beginning or resuming execution at least once in that interval. The height of each bar, or bar section, shows the number of context switches within the given interval.
View Options
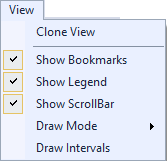
The View menu contains several options that allow you to change the graph’s display and content.
| Menu | Option | Description |
|---|---|---|
|
Clone View |
Creates a duplicate copy of the view in the same window. |
| Show Bookmarks |
Toggles display of bookmarks |
|
| Show Legend |
Toggles display of the color legend. |
|
| Show ScrollBar |
Toggles display of the scrollbar. |
|
| Draw Mode |
Choose a draw mode:
|
|
| Draw Intervals | Toggles display of intervals in the graph. |
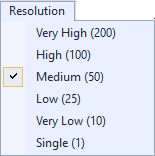
Resolution Options
| Menu | Option | Description |
|---|---|---|
|
Very High (200) High (100) Medium (50, default) Low (25) Very Low (10) Single (1) |
Determines the number of intervals to display. For a more detailed graph, increase the number of intervals by selecting a higher resolution. |
Related Topics ABOUT TRACEALYZER:
- About Tracealyzer
- Terminology
- Understanding the Tracealyzer User Interface
- Configuring Tracealyzer
- Tips, Tricks, and Notes
rELATED tOPICS ABOUT MONITORING:
