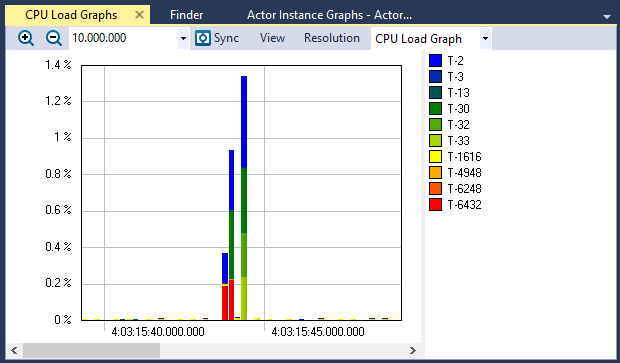
CPU Load Graphs
The CPU Load Graphs (Views > CPU Load Graphs) display CPU usage over time, per actor and in total. By default, it shows all actors except the idle thread. The analysis divides the trace into a number of intervals (100 intervals by default). The CPU usage for an actor in an interval is the amount of CPU time used by the actor within this interval, divided by the length of the interval. For each interval, all actors executing in that interval will be drawn as rectangles stacked on top of each other. The height of each actor's rectangle represents the CPU usage for that actor in that time interval and the combined height is the total CPU usage for that interval.
To customize the view, use the Select Actor(s) menu. There you can select which actors you wish to include in the view. If the graph is noisy (due to short intervals), you can reduce the number of intervals through the Resolution menu. If you wish a more detailed graph, you can increase the number of intervals by selecting a higher resolution. If you wish to focus on a specific area, you can click and drag to select an interval and use the Zoom menu or right click to zoom in on it. You can also use the Zoom or right click menu to show the selection or current view in the trace view or in all open views.
Clicking an actor in the graph will display information about that actor in the clicked interval and double clicking an actor will center the trace view on that interval. A gray outlined rectangle shows the interval of the current trace view. This rectangle may be very narrow and appear as a line if the trace view is small.
View Options
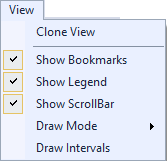
The View menu contains several options that allow you to change the graph’s display and content.
| Menu | Option | Description |
|---|---|---|
|
Clone View |
Creates a duplicate copy of the view in the same window. |
| Show Bookmarks |
Toggles display of bookmarks |
|
| Show Legend |
Toggles display of the color legend. |
|
| Show ScrollBar |
Toggles display of the scrollbar. |
|
| Draw Mode |
Choose a draw mode:
|
|
| Draw Intervals | Toggles display of intervals in the graph. |
Resolution Options
| Menu | Option | Description |
|---|---|---|
|
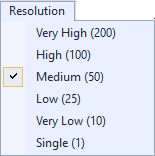
Very High (200) High (100) Medium (50, default) Low (25) Very Low (10) Single (1) |
Determines the number of intervals to display. For a more detailed graph, increase the number of intervals by selecting a higher resolution. |
To view information on an actor:
Click on an actor in the graph to display information about that actor in the selected interval.
Double-click an actor to center the Trace View on the selected interval. A gray outlined rectangle shows the interval of the current trace view. Note that the outlined rectangle may be very narrow and appear as a line if the trace view is small.
Related Topics ABOUT TRACEALYZER:
- About Tracealyzer
- Terminology
- Understanding the Tracealyzer User Interface
- Configuring Tracealyzer
- Tips, Tricks, and Notes
rELATED tOPICS ABOUT MONITORING:
