Event Intensity
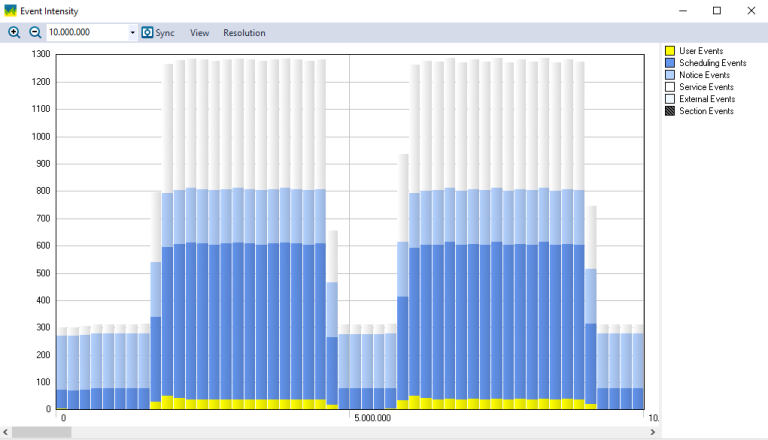
The Event Intensity view (Views > Event Intensity) displays the number of events per event type, during the selected interval.
By default, the interval is divided into 50 time slices. The number of slices can be changed via the Resolution or Time Resolution menus.
View Options
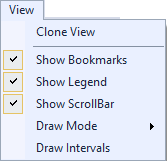
The View menu contains several options that allow you to change the graph’s display and content.
| Menu | Option | Description |
|---|---|---|
|
Clone View |
Creates a duplicate copy of the view in the same window. |
| Show Bookmarks |
Toggles display of bookmarks |
|
| Show Legend |
Toggles display of the color legend. |
|
| Show ScrollBar |
Toggles display of the scrollbar. |
|
| Draw Mode |
Choose a draw mode:
|
|
| Draw Intervals | Toggles display of intervals in the graph. |
Resolution Options
| Menu | Option | Description |
|---|---|---|
|
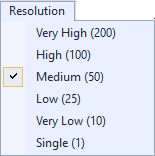
Very High (200) High (100) Medium (50, default) Low (25) Very Low (10) Single (1) |
Determines the number of intervals to display. For a more detailed graph, increase the number of intervals by selecting a higher resolution. |
Related Topics ABOUT TRACEALYZER:
- About Tracealyzer
- Terminology
- Understanding the Tracealyzer User Interface
- Configuring Tracealyzer
- Tips, Tricks, and Notes
rELATED tOPICS ABOUT MONITORING:
