Event Log
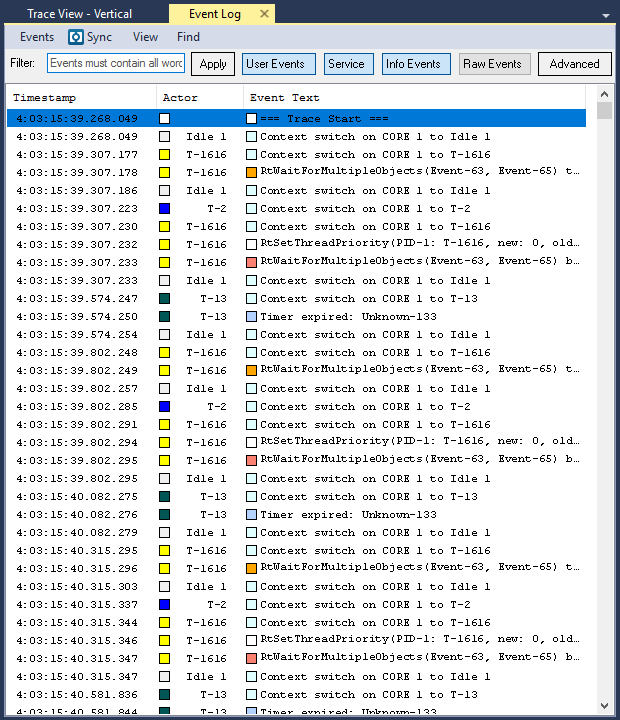
The Event Log (Views > Event Log) displays the trace as a textual event listing, with powerful filtering tools. The view also supports exporting the trace as text file.
TIP: Click on an entry to highlight the corresponding event in the Vertical Trace View.
Events
Use the Events > Export menu option to export the view as a text file. This can be used to compare traces (using a plain diff/merge tool) for debugging (compare the event order in two traces with different behavior) and for regression testing. All formatting and filtering used in the Event Log view is applied also in the Export function. This allows you to exclude irrelevant events and timestamps.
View Options
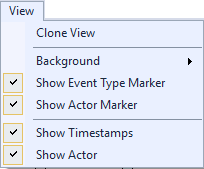
The View menu contains several options that allow you to change the graph’s display and content.
| Menu | Option | Description |
|---|---|---|
|
Clone View |
Creates a duplicate copy of the view in the same window. |
| Background |
Choose a background display type:
|
|
|
Show Event Type Marker |
Toggles display of event type markers. |
|
| Show Actor Marker |
Toggles display of the actor marker. |
|
| Show Timestamps |
Toggles display of timestamps. |
|
| Show Actor |
Toggles display of actors. |
Find
Use the options available from the Find menu to locate specific event or log message.
- Find – Opens the Find dialog. This lets you find an event or log message by string contents.
- Find Next – If a search pattern has been entered in the Find dialog, the next match will be shown. Otherwise the Find dialog will open.
- Goto Timestamp – Opens the Goto Timestamp dialog. This lets you find an event by timestamp.
Filter
The text box above the event log functions as a quick text-based filter. Type any text and click Apply, and only entries containing that text will be displayed. To revert to displaying all entries, delete the search string and click Apply again.
You can toggle visibility of User Events, Service, Info Events and Raw Events using the toggle buttons at the top of the view.
Click the Advanced button to open a panel with additional filtering options:
- By Content – In the upper part of the panel you have the line content filters. You can choose to include only entries matching one or more regex patterns and/or excluding any entry matching one or more regex patterns. Both text boxes supports multiple patterns by placing one pattern on each line.
- By Timestamp – By using the Exclude Events Before/After Timestamp filters, you can display events within a specific interval only.
- By Event Type – Use the Sources tree view at the bottom of the panel to select which types of events you want to include as well as which individual channels you want to include for user events.
Formatting
Use the options available from Formatting menu to configure the view.
- Show Timestamps – toggles the display of event timestamps.
- Color Events By Type – toggles the coloring of line backgrounds based on event type.
Related Topics ABOUT TRACEALYZER:
- About Tracealyzer
- Terminology
- Understanding the Tracealyzer User Interface
- Configuring Tracealyzer
- Tips, Tricks, and Notes
rELATED tOPICS ABOUT MONITORING:
