Interval Timeline
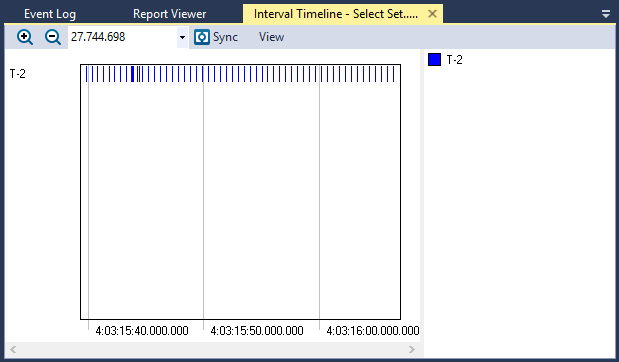
The Interval Timeline view (Views > Interval Plot) plot state intervals over time. This effectively provides a software logic analyzer. For more information on intervals, see Intervals and State Machines.
View Options
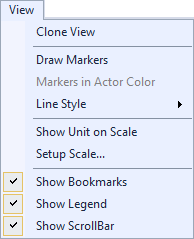
The View menu contains several options that allow you to change the graph’s display and content.
| Menu | Option | Description |
|---|---|---|
|
Clone View |
Creates a duplicate copy of the view in the same window. |
| Draw Markers |
Toggles display of markers. |
|
|
Markers in Actor Color |
Sets all markers to the actor color if Draw Markers is selected. |
|
| Line Style |
Choose a line style for the graph to display:
|
|
| Show Unit on Scale |
Toggles display of the units of measurement. |
|
| Setup Scale |
Opens the Setup Scale dialog, through which you can choose an automatic (default) or manual scale. |
|
| Show Bookmarks |
Toggles display of bookmarks |
|
| Show Legend |
Toggles display of the color legend. |
|
| Show ScrollBar |
Toggles display of the scrollbar. |
Related Topics ABOUT TRACEALYZER:
- About Tracealyzer
- Terminology
- Understanding the Tracealyzer User Interface
- Configuring Tracealyzer
- Tips, Tricks, and Notes
rELATED tOPICS ABOUT MONITORING:
