Service Call Block Time
The Service Call Block Time graphs (Views > Service Blocking > ...) display the service blocking times of the RTX64 calls that can block: RtWaitForSingleObjectEx and RtWaitForMultipleObjectsEx. Each data point represents a specific kernel service call, where the x-position indicates the point in time and the y-position the blocking time. Clicking a data point (a service call) will highlight it in the trace view. One use of this graph is to identify unintentional blocking, which can cause unusually high response times of threads.
This information is available for all objects (Views > Service Blocking > Service Call Block - All Objects) or a selected object (Views > Service Blocking > Service Call Block - Select Object).
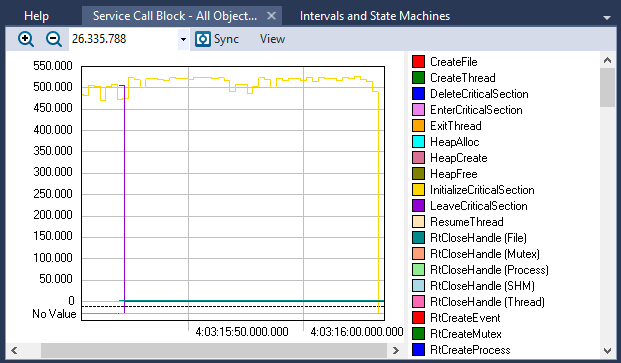
The Service Call Block - All Objects view
View Options
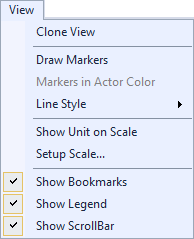
The View menu contains several options that allow you to change the graph’s display and content.
| Menu | Option | Description |
|---|---|---|
|
Clone View |
Creates a duplicate copy of the view in the same window. |
| Draw Markers |
Toggles display of markers. |
|
|
Markers in Actor Color |
Sets all markers to the actor color if Draw Markers is selected. |
|
| Line Style |
Choose a line style for the graph to display:
|
|
| Show Unit on Scale |
Toggles display of the units of measurement. |
|
| Setup Scale |
Opens the Setup Scale dialog, through which you can choose an automatic (default) or manual scale. |
|
| Show Bookmarks |
Toggles display of bookmarks |
|
| Show Legend |
Toggles display of the color legend. |
|
| Show ScrollBar |
Toggles display of the scrollbar. |
Related Topics ABOUT TRACEALYZER:
- About Tracealyzer
- Terminology
- Understanding the Tracealyzer User Interface
- Configuring Tracealyzer
- Tips, Tricks, and Notes
rELATED tOPICS ABOUT MONITORING:
