Actor Statistics Report
The Actor Statistics Report generator (Views > Actor Statistics Report) allows you to generate a high-level report on timing properties and CPU usage for the whole trace (if no selection exists in the main trace view), or the selected interval. The report can be saved as HTML, which allows you to store it for future reference, e.g., to compare timing and CPU load between different versions of your system.
When you launch the Statistics Report, a configuration dialog is shown through which you can select which actors and properties you wish to include in the report.
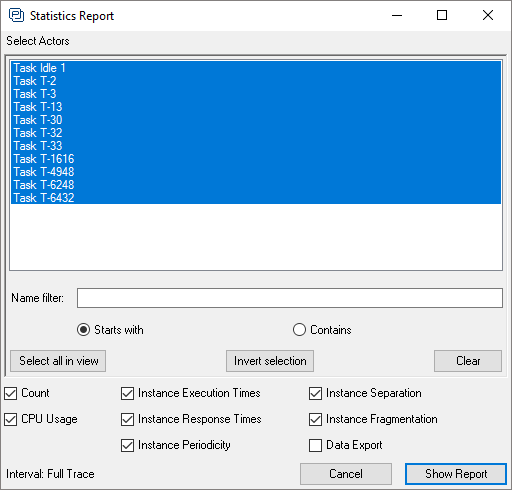
The available properties include high level statistics per task and ISR, like CPU usage, but also provide more details statistics for individual Actor Instances.
The interval in focus of the report is shown in the bottom. This can either be the selected interval from the main trace view, or the full trace if no selection exists.
Available properties:
- Count – The number of Instances of the Actor in the trace or selected interval.
- CPU Usage – The relative amount of processor time used by the Actor (in percent).
- Execution Time – The time in microseconds for executing one Actor Instance, excluding any time spent in preempting tasks and traced ISRs. If there are Actors not included in the trace (ISRs without trace calls, or excluded tasks), the reported Execution Time may include the time spent in such Actors.
- Response Time – The time from the start of an Actor Instance until it is finished. If "Actor Ready" events are included in the trace, those are counted as the starting point of the Instance.
- Periodicity – The time between two adjacent Instances of the same Actor, measured from start to start. If "Actor Ready" events are included in the trace, they are counted as the Instance start.
- Separation – The time between two adjacent Instances of the same Actor, measured from end to start. If "Actor Ready" events are included in the trace, they are counted as the Instance start. A separation of 0 means that the Instances follow in direct sequence.
- Fragmentation – The number of scheduling fragments within the Instance (i.e., the trace view rectangles). This value indicates the number of interruptions, e.g., ISRs, preemptions by higher priority tasks, blocking on mutexes etc.
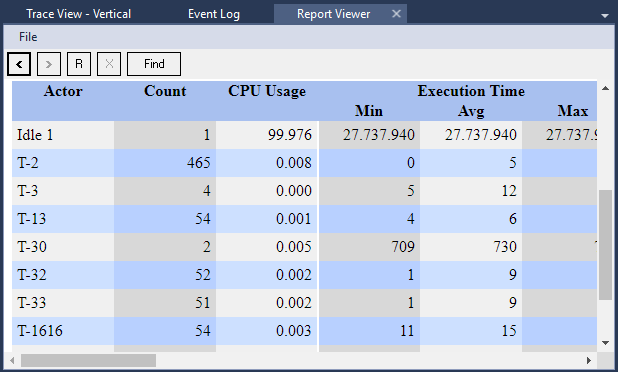
Click Show Report to generate the report. The report contains a summary table, as shown in the example below.
Related Topics ABOUT TRACEALYZER:
- About Tracealyzer
- Terminology
- Understanding the Tracealyzer User Interface
- Configuring Tracealyzer
- Tips, Tricks, and Notes
rELATED tOPICS ABOUT MONITORING:
