User Event Signal Plot / Advanced
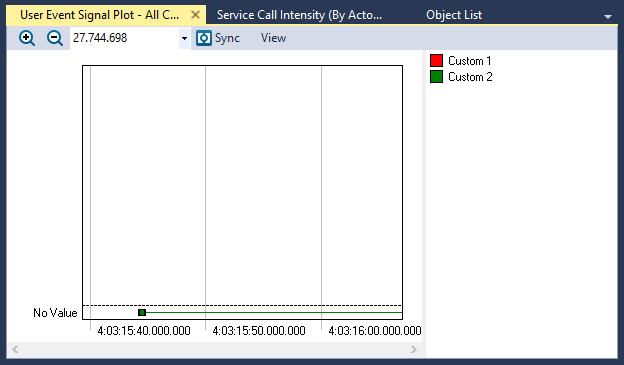
The User Event Signal Plot views display plots of data values from User Events—custom events generated by RtGenerateEvent. Each plotted curve represents a signal, which is a group of user events according to the definition of the signal.
Custom events contain the following:
- An arbitrary unsigned 32-bit integer called the custom event kind.
- 0 to 512 bytes of arbitrary data, which might be a string, or it might be binary data.
Tracealyzer includes two User Event Signal Plot views, each available from the Views menu:
- User Event Signal Plot – the simple user event plot view.
- User Event Signal Plot (Advanced) – an advanced view which includes additional options, including the ability to set up a signal via the Signal Setup dialog. To use this view, you must understand how to write regular expressions.
Both views work with custom events parsed with a definitions file. The advanced view is only needed if you need regular expressions to extract the values from a string.
A user event in Tracealyzer can include one or more raw values in addition to the formatted string. When just setting the default custom event format under Settings, or when not using a format, no such value will be set in the event, but when a definitions file is used for an event type, the raw values will be set. The simple user event plots the first numeric raw value of any user event, ignoring all formatting.
The User Event Signal Plot (Advanced) view extracts values from the formatted strings using regular expressions. If you were to store a single int or float in a custom event, parse it using a custom event definitions file, and then plot it using the User Event Signal Plot (Advanced) view, you’ll effectively convert the binary value to a string and then parse the string back to the same binary value and then plot it.
NOTE: The numeric value of the floating point number is likely to be distorted by these binary-to-text/text-to-binary conversions.
Plotting of user event signals is useful for analyzing control system inputs and outputs, but you can use it to visualize other data. Like other Tracealyzer views, this is connected to the main trace view, which allows for correlating the signal values with the scheduling and other recorded events.
For instance, if you spot an anomaly in a monitored output signal of a control loop, you can click on the data point to show the specific user event in the trace view. This allows you to analyze what was going on at this time — perhaps the scheduling caused an extra delay of the control loop thread which affected the signal.
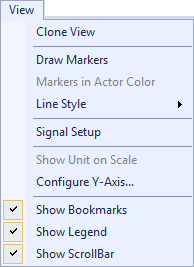
View Options
The View menu contains several options that allow you to change the graph’s display and content.
| Menu | Option | Description |
|---|---|---|
|
Clone View |
Creates a duplicate copy of the view in the same window. |
| Draw Markers |
Toggles display of markers. |
|
|
Markers in Actor Color |
Sets all markers to the actor color if Draw Markers is selected. |
|
| Line Style |
Choose a line style for the graph to display:
|
|
|
Signal Setup |
(Advanced view only.) Opens the Signal Setup dialog, through which you can create signals for plotting user events data. |
|
| Show Unit on Scale |
Toggles display of the units of measurement. |
|
| Configure Y-Axis | (Advanced view only.) | |
| Setup Scale |
(Default view only.) Opens the Setup Scale dialog, through which you can choose an automatic (default) or manual scale. |
|
| Show Bookmarks |
Toggles display of bookmarks |
|
| Show Legend |
Toggles display of the color legend. |
|
| Show ScrollBar |
Toggles display of the scrollbar. |
Signal Setup
Use the Signal Setup dialog, available under View > Signal Setup in the User Event Signal Plot (Advanced) view, to create signals for plotting user events data. Note that this is just one way to create a signal. The simple view plots signals defined in the XML definitions file.
A signal is essentially a filter that is applied on all user event strings to extract the values to plot, in the form of a regular expression and some related settings. Two signals are predefined, intended for use with the included demo trace, but you can edit or delete them as needed.
Templates are provided that are easy to import and adaptable.
NOTE: All changes made are stored on disk automatically.
The Signal Setup dialog displays all of your signals in a list view. You can manage your signals using these options:
- New – creates a new "empty" signal.
- Copy – creates a copy of the selected signal.
- Import – import a set of signals from an XML file generated by the Export feature.
- Export – save your signals in a specified file. This simply creates a copy of the internal file that stores the signal setup.
- Delete – deletes the selected signal.
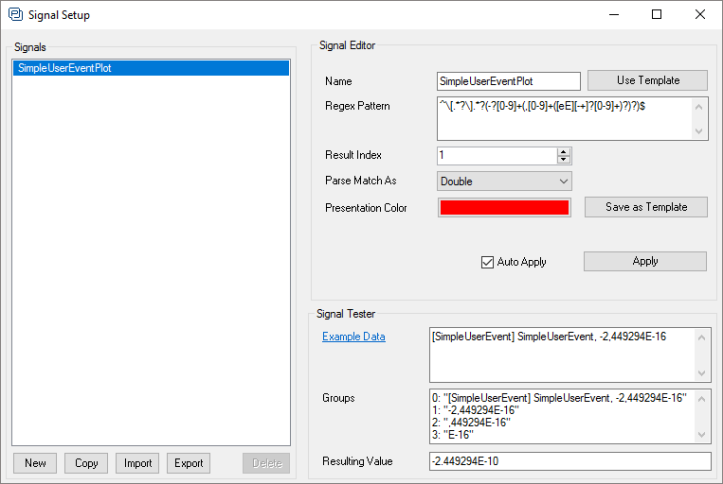
Use the Signal Editor, located in the upper right of the Signal Setup dialog, to edit the selected event channel.
- Name –the signal name shown in the User Event Signal Plot window.
- Use Template – opens a new dialog with general templates that can be imported (see Signal Templates below).
- Regex Pattern – a regular expression used to extract the value to plot from the user event labels. To limit the plot to a specific User Event Channel, start the expression with the User Event Channel Name in brackets.
For example, this expression matches all events on User Event Channel "SinWave" that contains a message like "Value: [number]".
\[SinWave\].*Value\:[ ]*(-?[0-9]+)
See Defining Parsing Rules for Custom Events in Tracealyzer for information on how to define channel names.
Regular expressions use the .NET Framework regular expression engine, which is Perl 5 compatible. If you are unfamiliar with regular expressions, there are plenty of tutorials available at http://www.zytrax.com/tech/web/regex.htm.
- Result Index – the regular expression may produce a group of results. This value allows you to select the right result from the regular expression by setting the result list index. To study what results a certain regular expression generates, use the Signal Tester explained below.
- Parse Match As – choose whether to interpret the resulting value as a decimal integer, a hexademimal integer or a double-precision floating point value.
- Presentation Color – click on the colored button to select the color of this signal in the User Event Signal Plot view.
- Save as Template – stores the currently selected signal as a signal template for future use (see Signal Templates, below).
- Auto Apply – determines whether the settings should be applied and saved automatically when changed. If this is unchecked, you need to use the Update button to save your changes.
- Apply – saves and applies any changes to the currently selected signal. This is disabled when Auto Update is enabled (default). Clear the selection for Auto Update to enable this button.
Use the Signal Tester, located in the lower right of the Signal Setup dialog, to test the selected signal using example data. Signal Tester contains three fields:
- Example Data – enter any text in the text field to use as example input to the regular expression in the current signal setup. You may also click on the Example Data label to open a list of all user events in the trace, where you can select a user event to use as example data.
- Groups – a regular expression may give multiple results. This shown all results produced by the current regular expression on the example data. Use Result Index in the Signal Editor to select what result to use. The first result has index 0.
- Resulting Value – the value that will be plotted based on the current signal and the example data.
If the signal setup is incorrect for some reason, the specific input field turns red.
Signal Templates
You can load and save signal setups as templates for future use using the Use Template and Save as Template options. Both options open the Signal Templates dialog that displays the templates available in a grid view. The grid view contains one line per template, with the same properties as in the editor, except that color is not a part of the template and there is also an extra field for a description of the template.
NOTE: The name field is the template name, not the signal name, so this is not copied to the Signal Editor when applying the template.
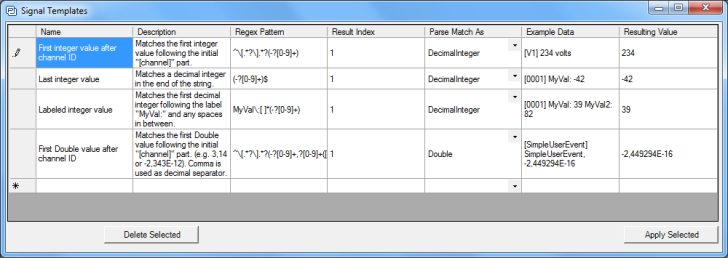
The Signal Templates dialog contains these options:
- Reset Templates – restores the original templates, removing any user changes.
- Delete Selected – deletes the selected template.
- Apply Selected – applies the template to the Signal Setup Editor (on the currently selected signal setup).
To create a new template:
To create a new template, edit the empty line at the bottom of the grid view, and then press Enter. If there is an error in the template, the Resulting Value cell of the affected row will turn red.
To edit an existing template:
Edit the fields corresponding to that template directly in the grid view. When you edit a template, the changes are automatically evaluated using the example data and the result is then shown in the Resulting Value column.
Related Topics ABOUT TRACEALYZER:
- About Tracealyzer
- Terminology
- Understanding the Tracealyzer User Interface
- Configuring Tracealyzer
- Tips, Tricks, and Notes
rELATED tOPICS ABOUT MONITORING:
