Measuring Timer Latencies
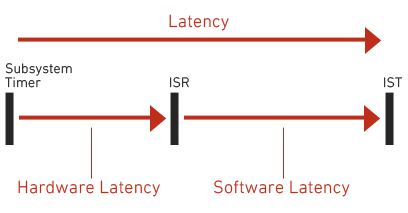
System Timer Response Latency is measured as the total time from when a Subsystem timer interrupt sends a signal to when that signal is recognized by software running in an Interrupt Service Thread (IST). As shown in the diagram below, Latency is made up of Hardware latency, the time it takes for a signal to be recognized by an Interrupt Service Routine (ISR), and Software latency, the time it takes from ISR to the routine running in IST.
The RTX64 Runtime provides a utility called System Response Time Measurement (SRTM), a real-time API timer latency measurement tool that measures timer latency observed by the application. Each of the two supplied versions of SRTM, Windows and RTSS, measures its own environment. An SRTM histogram often shows a characteristic double peak profile: the first peak is a near-best case; the second is the dirty-cache case. The diagram occasionally shows additional smaller spikes from processor-level interrupt masking.
By default, this tool generates a 15-second tone and prints a histogram of timer response latencies. You can run SRTM in the RTSS environment to measure RTSS latencies.
To measure timer latency, type the following at a command prompt:
RTSSrun "c:\program files\IntervalZero\RTX64\bin\srtm.rtss" [-h][-s][-1][f] seconds_to_sample
The RTX64 Runtime provides a utility called Kernel System Response Time Measurement (KSRTM). KSRTM is a driver and a Windows utility that measures HAL-level timer latency. Short code paths make it less sensitive to cache jitter than Srtm. It can determine which Windows OS component or device driver is causing the greatest latency event for a real-time application.
KSRTM measures timer response latencies and obtains reports and histograms of the results.
