Debugging a RTDLL with Visual Studio
The following steps will demonstrate a simple Visual Studio debug session, when the application uses an RTDLL. An RTDLL is a real-time dynamic linked library, similar to a Windows DLL, so it can be debugged within the Visual Studio instance that is debugging your application.
To debug an RTX64 application and an RTDLL, do the following:
- Start Visual Studio and Open the Solution
- Add Projects to the Solution
- Build Projects in the Solution
- Debug the Program and RTDLL
Start Visual Studio and Create a New Solution
Create the solution:
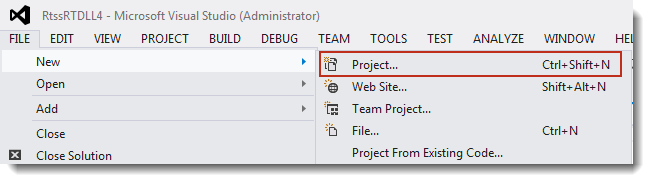
- Start Microsoft Visual Studio and create a new project using: File > New > Project
- When the New Project window appears, expand Other Project Types, click Visual Studio Solutions and then select Blank Solution. Specify the location that you will store project files and then click OK.
- You should now have a blank solution. Open an existing project that contains an RTDLL by right-clicking the solution name in the Solution Explorer window and selecting Add > Existing Project.
- Browse to the IntervalZero Samples directory, and select the RTDLL sample. If you installed in the default directory you would go to
%public%\Documents\Intervalzero\RTX64 SDK\4.5\Samples\RTDLLand select the projectSampleRTDLL_VS2019and click OK. - The
SampleRTDLL_VS2012project is added to your solution. When you open it you will see it contains a single source file,SampleRtdll.c.
Open the application that will use the RTDLL:
- In the Solution Explorer window, right-click the solution name and select Add > Existing Project from the pull-down menu.
- Browse to the IntervalZero Samples directory, and select the RTDLL sample. If you installed in the default directory you would go to
%public%\Documents\Intervalzero\RTX64 SDK\4.5\Samples\RTDLLand select the projectExplicitLoadRTDLL_VS2019and click OK. - The
ExplicitLoadRTDLL_VS2019project is added to your solution. When you open it you will see it contains a single source file,ExplicitlyUsingRtdll.c.
You should now have a solution with the two projects. The SampleRtDll_VS2019 project will create an RTDLL and the ExplicitLoadRTDLL_VS2019 project will create an RTSS process that will use the RTDLL.
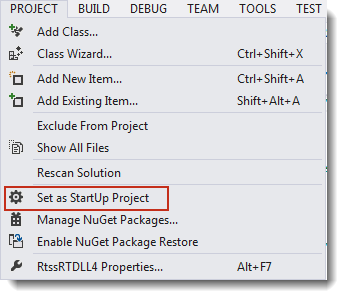
The program that will use the DLL should start when debugging begins. To ensure this, right-click on the ExplicitLoadRTDLL_VS2019 project from the Solutions Explorer window and selecting Set as StartUp Project from the pull-down menu.
Build the Solution
Steps:
- To select which configuration will be built, select Batch Build from the Build pull-down menu.
- This tutorial will only use the RTSSDebug configurations. You can check only SampleRtDll_VS2019 RTSSDebug configuration and ExplicitLoadRtDll RTSSDebug configuration. After configuration options have been selected, click Rebuild.
- Output from the build will be displayed in the Output window.
The solution directory will now have executable files for each of the projects in the subdirectory \bin\RTSSDebug.
Perform Debug of Program and RTDLL
NOTE: Data breakpoints are not supported.
Steps:
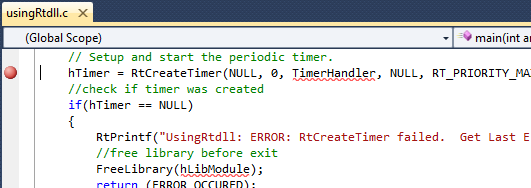
- Set the first breakpoint in program
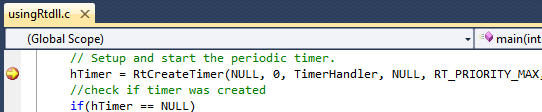
UsingRTDLL.cby double-clicking in the column to the left of theRtCreateTimerfunction call or by right-clicking on the line and clicking Breakpoint > Insert Breakpoint in the pop-up menu.
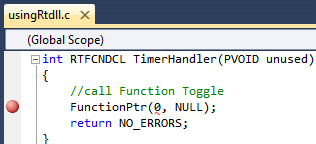
- Set a second breakpoint in program
ExplicitlyUsingRTDLL.cby double-clicking in the column to the left of the call to function toggle (pointed to byFunctionPtr). This function is located in the RTDLL.
- To start debugging, select Start Debugging from the Debug pull-down menu, or press the F5 key.

- If you get a message asking if you would like to rebuild the SampleRTDLL click No. A rebuild is not necessary since there were no changes since the previous build.
- The debugger will stop at the first breakpoint, pointed to by a yellow arrow in a red circle.
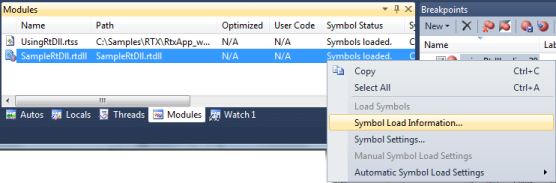
- At the first breakpoint, click Modules at the bottom of the window. If symbols are not loaded for either of the modules, right-click and select Load Symbols from the pull-down menu.
NOTE: If Modules is not available from the status bar at the bottom of the window, select Modules from the Windows option in the Debug pull-down menu to open the modules window.
- If necessary, locate the symbol file in the RTSSDebug subdirectory.
The Output window should now indicate that symbols are loaded.
- To continue from the first breakpoint, select Continue from the Debug pull-down menu or press the F5 key.
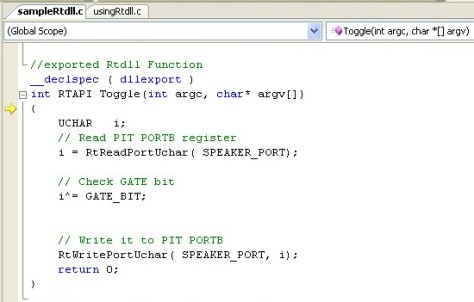
- When the debugger stops at the second breakpoint, if this is the call to the toggle function, select Step Into or press the F11 key to step into the DLL function.
Focus will now turn to the SampleRTDLL.c source code.
- To continue, select Step Out from the Debug pull-down menu or press Shift+F11.
When focus returns to the SampleRTDLL.c program, you can select to Continue or to Stop Debugging from the Debug pull-down menu. If you select Continue, program execution will continue until it completes or reaches another breakpoint. If you select Stop, program execution will halt.
