Event Intensity
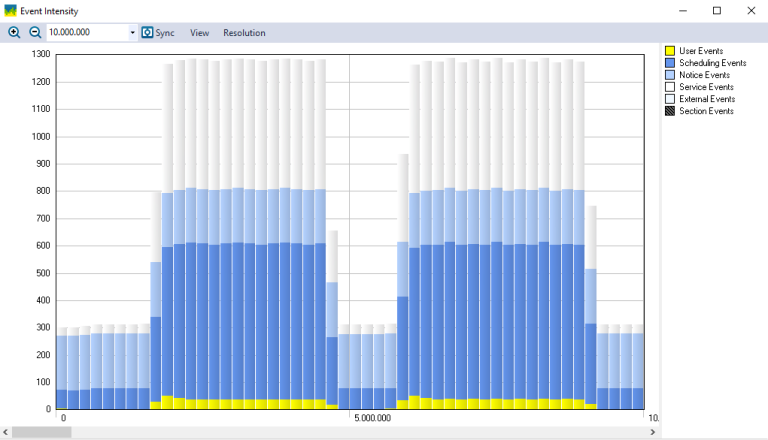
The Event Intensity view (Views > Event Intensity) displays the number of events per event type, during the selected interval.
By default, the interval is divided into 50 time slices. The number of slices can be changed via the Resolution or Time Resolution menus.
View Options
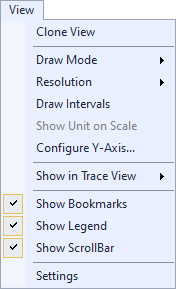
The View menu contains several options that allow you to change the graph’s display and content.
| Option | Description |
|---|---|
| Clone View |
Creates a duplicate copy of the view in the same window. |
| Draw Mode |
Choose a draw mode:
|
| Resolution |
Determines the number of intervals to display. For a more detailed graph, increase the number of intervals by selecting a higher resolution.
|
| Draw Intervals | Toggles display of intervals in the graph. |
| Show Unit on Scale |
Toggles display of the unit on the scale if the current data supports the unit. If the data does not support the unit, this option is grayed-out. |
| Configure Y-Axis... | Opens the Configure Y-Axis dialog, through which you can choose an automatic (default) or manual setup. |
| Show in Trace View |
Show this data in the current Trace View or create a new Trace View to show the data. |
| Show Bookmarks |
Toggles display of bookmarks |
| Show Legend |
Toggles display of the color legend. |
| Show ScrollBar |
Toggles display of the scroll bar. |
| Settings | Opens the View Settings dialog, through which you can set current and default settings for this view. |
Related Topics ABOUT TRACEALYZER:
- About Tracealyzer
- Terminology
- Understanding the Tracealyzer User Interface
- Configuring Tracealyzer
- Tips, Tricks, and Notes
rELATED tOPICS ABOUT MONITORING:
- Application Monitoring
- Understanding Persistent vs. Transient
- Changing Default Monitor Settings (RTX64 Control Panel)
- RTX64 Monitor
- Event Classes
