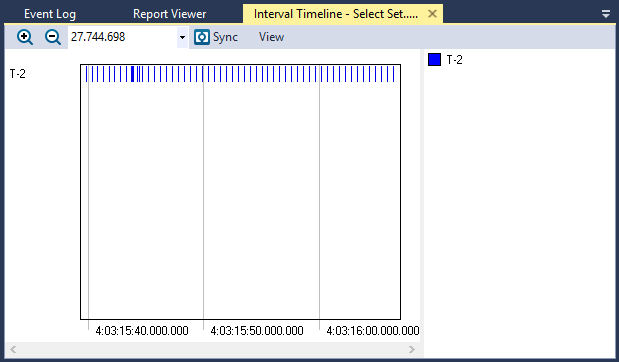
Interval Timeline
The Interval Timeline view (Views > Interval Plot) plot state intervals over time. This effectively provides a software logic analyzer. For more information on intervals, see Intervals and State Machines.
View Options
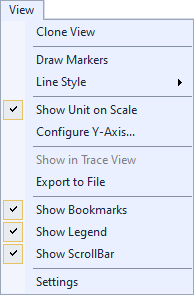
The View menu contains several options that allow you to change the graph’s display and content.
| Option | Description |
|---|---|
| Clone View |
Creates a duplicate copy of the view in the same window. |
| Draw Markers |
Toggles display of markers. |
| Line Style |
Choose a line style for the graph to display:
|
| Show Unit on Scale |
Toggles display of the units of measurement. |
| Configure Y-Axis... | Opens the Configure Y-Axis dialog, through which you can choose an automatic (default) or manual setup. |
| Show in Trace View |
Show this data in the current Trace View or create a new Trace View to show the data. |
| Export to File | Opens the Export Graph dialog, through which you can export the graph data to a CSV file. |
| Show Bookmarks |
Toggles display of bookmarks |
| Show Legend |
Toggles display of the color legend. |
| Show ScrollBar |
Toggles display of the scroll bar. |
| Settings | Opens the View Settings dialog, through which you can set current and default settings for this view. |
Related Topics ABOUT TRACEALYZER:
- About Tracealyzer
- Terminology
- Understanding the Tracealyzer User Interface
- Configuring Tracealyzer
- Tips, Tricks, and Notes
rELATED tOPICS ABOUT MONITORING:
- Application Monitoring
- Understanding Persistent vs. Transient
- Changing Default Monitor Settings (RTX64 Control Panel)
- RTX64 Monitor
- Event Classes
