Object History
The Object History view displays all service calls for a specific event, or memory allocations (malloc/free) on a Heap event. Each line in the Object History view corresponds to an event - the actor making the call, the type of event, and the status of the object.
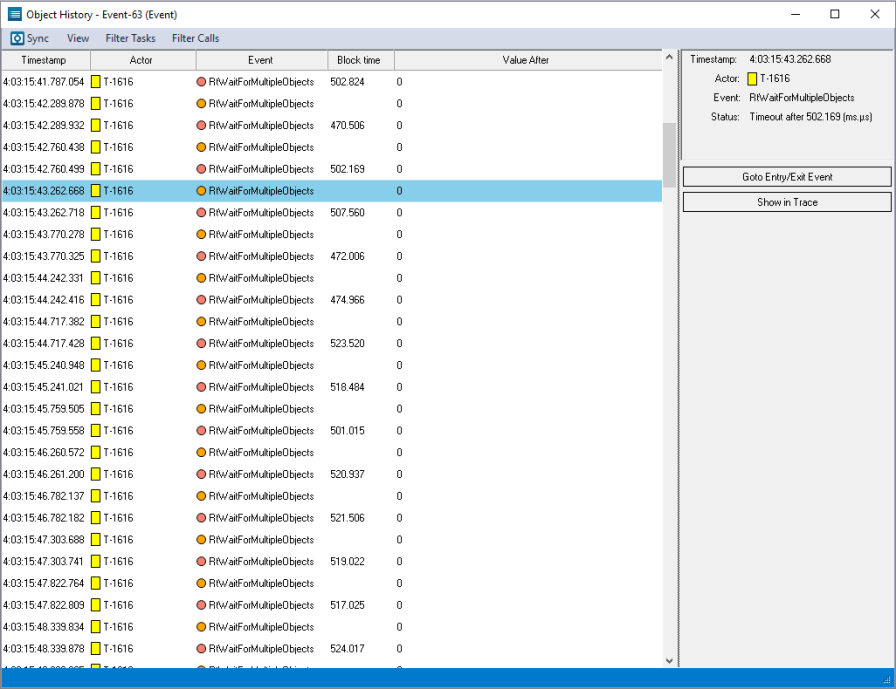
The event list can be filtered to only display events of a certain service or from a certain thread. Clicking an event will display details about it in the panel to the right, which also features navigation buttons. Double-clicking an event will highlight it in the trace view.
When viewing heap events, such as malloc and free, it is also possible to filter out all the allocations that have been freed, leaving only the remaining allocation. This can be used to find any memory leaks. See also Memory Heap Utilization.
View Options
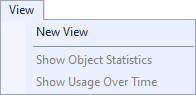
The View menu contains several options that allow you to change the graph’s display and content.
| Option | Description |
|---|---|
| New View |
Opens the Select Object dialog, through which you can select a new object to view history information for. |
| Show Object Statistics |
Opens the Object Statistics dialog, which displays read-write usage by task and other information on the selected object. |
| Show Usage Over Time |
Displays the usage over time for the selected object. |
Related Topics ABOUT TRACEALYZER:
- About Tracealyzer
- Terminology
- Understanding the Tracealyzer User Interface
- Configuring Tracealyzer
- Tips, Tricks, and Notes
rELATED tOPICS ABOUT MONITORING:
- Application Monitoring
- Understanding Persistent vs. Transient
- Changing Default Monitor Settings (RTX64 Control Panel)
- RTX64 Monitor
- Event Classes
