Object List
The Object List (Views > Object List) displays all service calls for a specific object, or memory allocations (malloc/free) on a Heap object. This view is easiest to open by double-clicking on an event label, e.g., in the Vertical Trace View. Each line corresponds to an event - the actor making the call, the type of event and the status of the object.
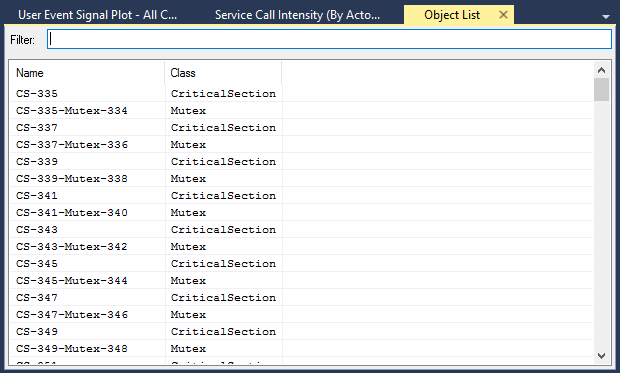
The event list can be filtered to only display events of a certain service or from a certain task, using the Filter menu. Clicking an event will display details about it in the panel to the right, which also features navigation buttons. Double-clicking an event will highlight it in the trace view.
Related Topics ABOUT TRACEALYZER:
- About Tracealyzer
- Terminology
- Understanding the Tracealyzer User Interface
- Configuring Tracealyzer
- Tips, Tricks, and Notes
rELATED tOPICS ABOUT MONITORING:
- Application Monitoring
- Understanding Persistent vs. Transient
- Changing Default Monitor Settings (RTX64 Control Panel)
- RTX64 Monitor
- Event Classes
