RTX64 Latency View
RTX64 Latency View displays a visual comparison of latency between Windows and RTX64 cores. System Timer Response Latency is measured as the total time from when a Subsystem timer interrupt sends a signal to when that signal is recognized by software running in an Interrupt Service Thread (IST).

The tool repeatedly captures data over 1 second intervals and provides a graphical display of the maximum value for that period for each core. Accumulated Min, Max and Average values are also displayed per core. You can view latency values from 32-bit and/or 64-bit processes running on Windows cores and compare it to latency values for 64-bit processes running on RTSS cores. You can optionally add video and/or disk loads to selected cores, which simulate system activity in order to show more accurately the maximum latency times on a busy system.
Configuring and running a test in RTX64 Latency View
- Click Start > All Programs > IntervalZero RTX64 Latency View > RTX64 Latency View.
- The RTX64 Latency View dialog appears. Click the configure icon to expand the Configure menu.

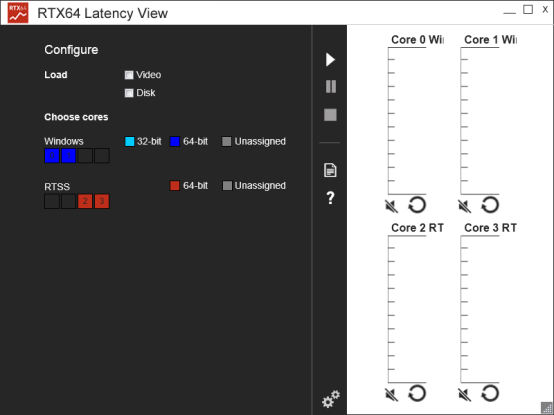
- The Configure menu displays the total number of cores configured on your system. To select the Windows and RTSS cores you want to include in the performance test, click on a core indicator:
- Windows – click on a Windows core to select it. You can toggle 32-bit (aqua blue), 64-bit (dark blue), or unassigned (light gray).
- RTSS – click on a RTSS core to select. You can toggle 64-bit RTSS cores or unassigned.
NOTE: Dark gray indicates that a core is not selectable.
- Optionally, click to add a Video or Disk load. You can also add loads while a test is running.
- Once you have finished configuring your test, click the start icon. Graphs display live results in the main RTX64 Latency View window, based on selected Windows and RTSS cores.
Latency View Options
| Option | Icon | Description |
|---|---|---|
|
Run Test |

|
Run the latency test with the selected cores. |
|
Stop Test |

|
Stop the current test. |
|
Pause Test |

|
Pause the current test without losing existing data. |
|
Save Log File |

|
Save test results to a log file. |
|
Configure Test |

|
Select the Windows and RTSS cores to include in the latency comparison. |
|
Toggle Sound |
  |
The timer function toggles the output state of the system speaker port each time it is called. Since the timer function is called periodically, this results in a tone with a period equal to one half of the timer setting value. The system timer is set to 1 ms, resulting in a 500 Hz tone. |
|
Reset |

|
Reset accumulated statistics. |
|
Help |

|
View Help information on the Latency View tool. |
See Also:
