Performance
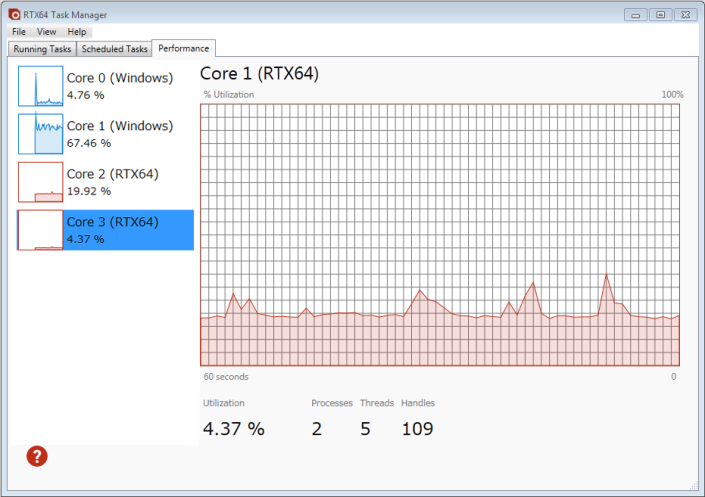
The Performance tab in Task Manager displays CPU usage information for all processors assigned to either Windows or RTX64. Processors are listed vertically along the left side of the page. Each processor entry displays CPU usage in graph form as well as a percentage value. Select a processor from the list to see an enlarged usage graph as well as additional details, such as a count of the running processes, threads, and handles.
Expanded Processor Information
The expanded processor view displays information for the selected processor. By default, information on the first processor is displayed.
- Usage Graph: a visual representation of the processor’s current CPU usage (0-100%) over 60 second intervals.
NOTE: When Update Speed (View > Update Speed) is Paused, the word Paused appears beneath the usage graph where the 60 seconds interval text is otherwise displayed.
- Utilization: a percentage value of the processor’s current CPU usage. This information also appears in a tooltip when you hover the mouse cursor over the usage graph.
- Processes: the number of running processes on the selected processor.
- Threads: the number of threads on the selected processor.
NOTE: Detailed information on the thread(s) in a process is available from the Running Tasks tab.
- Handles: the number of handles on the selected processor.
NOTE: Process RTX64TMAgent.rtss polls the subsystem for usage data and delivers that data to Task Manager. To minimize its impact, Task Manager will run the process on the last possible core assigned to RTX64. This may result in short spikes of high CPU usage every 3 seconds.
Related topics:
