eRTOS SDK allows you to use the familiar Microsoft Visual Studio development environment. You can debug eRTOS applications and applications that use an RTDLL.
Note: The MaxRT eRTOS Debugger supports relative pathnames.
Debugging an eRTOS Application in the Debugger
eRTOS provides a Visual Studio integrated base debugger and launch provider that Visual Studio uses when debugging real-time applications.
Note: Data breakpoints are not supported.
To use Visual Studio to debug:
-
Ensure that eRTOSDebug is selected from the Solutions Configurations pull-down menu.
-
In Solution Explorer, right-click on the project and select Properties. Open Debugging tab.
-
Ensure that MaxRT eRTOS Debugger is the selected debugger. The eRTOSDebug configuration selects this debugger by default.
-
Make the following changes to the properties:
| Settings | Value |
| Command | C:\eRTOS\bin\eRTOSApp1.ertos |
| Remote Server Name | The IP address of the eRTOS target. For example: 192.168.100.50 |
|
Remote Deploy (optional) |
|
Note: The Command value $(TargetPath) must be a valid eRTOS drive letter.
-
Set a breakpoint in the application.
-
Select Build Solution from the Build pull-down menu.
-
Ensure that RtVsMon.ertos is started on the eRTOS target computer and waiting on the remote connection.
-
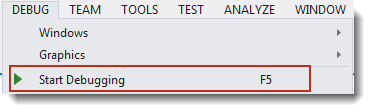
Click Start Debugging or press F5.
eRTOS provides a Visual Studio integrated base debugger and launch provider that Visual Studio uses when debugging Real-time applications. eRTOS applications are started by the eRTOS loader. For this reason, when debugging eRTOS applications in Visual Studio, the following options in the Debug pull-down menu (which would assume Windows control) are not supported:
- Attach to Process
- Detach All
Build Configurations
Two configurations for creating applications are generated in Visual Studio when you create a project using the eRTOS Application template:
x64
- eRTOSDebug – Real-time application that has debug flags enabled
- eRTOSRelease – Optimized Real-time application that does not contain additional debug information
Note: We recommend selecting the eRTOSDebug configuration of the application you want to debug, as this configured to generate debug information.
Real-Time Debugger
When you create an eRTOS application with the eRTOS Application template, a new debugger option, MaxRT eRTOS Debugger, is added to Visual Studio. You can use this debugger to debug eRTOS applications on a target system remotely.
- MaxRT eRTOS Debugger – use to debug eRTOS applications on a target system remotely.
Set Debugging Properties
Optionally, you can set debugging properties for the application you want to debug. You can:
- Set the ideal processor on which the main thread of the debugged process will run.
- Set the affinity mask that specifies the processor(s) on which the debugged process will run.
- Set the external MSpace initial size (in kilobytes) for the debugged process.
- Set the external MSpace expand size (in kilobytes) for the debugged process.
See Setting Debugging Properties in Visual Studio for more information.
Related Topics:
MiniTutorials: