Debugging an eRTOS Application with Visual Studio
The following steps will demonstrate a simple Visual Studio debug session, using one of the provided eRTOS sample programs. Follow along to:
- Start Visual Studio and open an existing project
- Build the project
- Perform simple debugging
Start Visual Studio
Steps:
- To begin your debug session, start Microsoft Visual Studio.
- Open an existing project by clicking File > Open > Project
- Browse to the IntervalZero Samples directory and select the SRTM sample. If you installed in the default directory you would go to
%public%\Public Documents\IntervalZero\eRTOS SDK\Samples\SRTMand select the solutionSRTM_VS2019and click OK.
- The SRTM solution will open. The project called
SRTM_VS2019contains a single source file,Srtm.c.
Build the Project
When a project like SRTM is generated using the eRTOS Application template, it contains a solution with two 64-bit configurations to build eRTOS executable files with and without debug symbols (eRTOSDebug / eRTOSRelease). These solution configurations can be seen in the pull-down menu.
Steps:
- To build an eRTOS configuration that can be debugged, select the eRTOSDebug configuration. See Remote Debugging with Visual Studio for more details about how to set up and run RtVSMon.
- From the Build menu select Rebuild Solution.
The build output will display in the Output window at the bottom of the screen. If the output window is not visible, select Output from the View pull-down menu.
1>------ Build started: Project: Srtm_VS2019, Configuration: eRTOSDebug x64 ------
1>Srtm.c
1>Srtm_VS2019.vcxproj -> C:\Users\Public\Documents\IntervalZero\eRTOS SDK\Samples\Srtm\VS2019\bin\debug\Srtm.ertos
1>eRTOS Stamptool
1>Stamptool: Successfully stamped file 'C:\Users\Public\Documents\IntervalZero\eRTOS SDK\Samples\Srtm\VS2019\bin\debug\Srtm.ertos'!
1>Done building project "Srtm_VS2019.vcxproj".
========== Build: 1 succeeded, 0 failed, 0 up-to-date, 0 skipped ==========
Debug
Note: Data breakpoints are not supported.
Steps:
-
Copy Srtm.ertos binary from host machine to the command line path on the Target system that you specified in the Configuration Properties > Debugging dialog on the Host system.
- From the Solution Explorer window, open the source file SRTM.c by right-clicking the file name and selecting Open or double-clicking the file name.
- Set the first breakpoint by double-clicking in the column to the left of the RtCreateTimer function call, or by right-clicking on the line and clicking Breakpoint > Insert Breakpoint in the pop-up menu.

- Set a second breakpoint by double-clicking in the column to the left of the RtGetClockTime function call.

-
On the target system, configure and start RtVsMon.ertos. For more details, see Remote Debugging with Visual Studio.
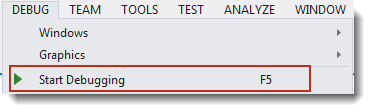
- To start debugging, select Start Debugging from the Debug pull-down menu, or press the F5 key.
- The eRTOS Console will display text from the program, and then the debugger stops the program at the first breakpoint.
-
Select Continue from the Debug pull-down menu or press the F5 key to continue from the breakpoint.
- View variable values in the Autos window When the debugger stops at the second breakpoint. If the debug windows are not visible, use the Windows option in the Debug pull-down menu to display them. Press the F5 key to continue debugging.
- While debugging, you can select Continue or Stop Debugging from the Debug pull-down menu. If you select Continue, program execution will continue until it completes or reaches another breakpoint. If you select Stop, program execution will halt.
After you have finished the debug session, you can close the Visual Studio on host machine.