|
|
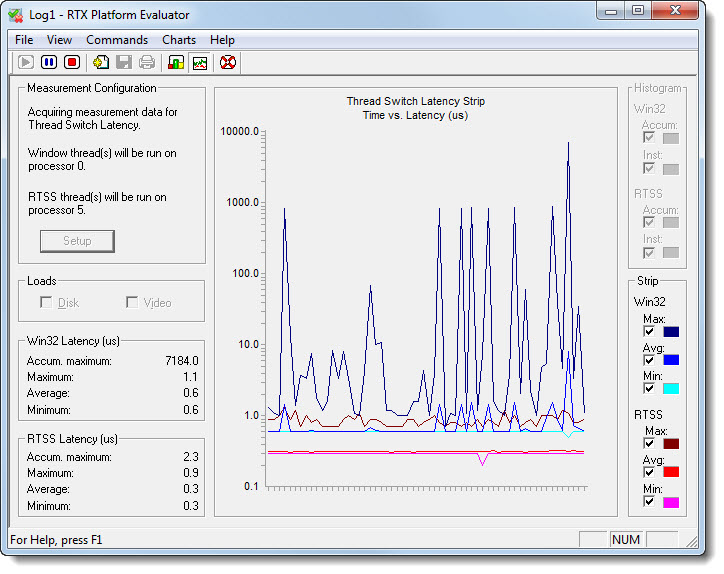
Strip view shows the latencies as they are measured in a line chart of latency (Y axis) vs. time (X axis). Six measurements can be displayed, each in different and customizable colors: Win32 and RTSS measurements of minimum, maximum, and average values.
Strip Chart
To view a strip chart:
