Tracealyzer for RTX64 (3.5 and Earlier)
NOTE: This documentation is for Tracealyzer for RTX64 3.5 and earlier. If you are using a newer version of RTX64, you’ll want to see the documentation for Tracealyzer for RTX64 3.6 and later.
Tracealyzer's diagnostic capabilities allow you to see elements in your application that require optimization. For instance, Tracealyzer might reveal unnecessary resource conflicts in an application, which, when optimized, could result in a significant improvement in real-time responsiveness and performance.
Tracealyzer provides more than twenty interlinked views of application behavior, including scheduling and timing, interrupts, and interaction between threads and user events generated from your application. Tracealyzer can be used side-by-side with traditional debugging tools, and complements the debugger view with a higher level perspective, which is ideal for understanding more complex errors that cannot be analyzed through a typical debugging session.
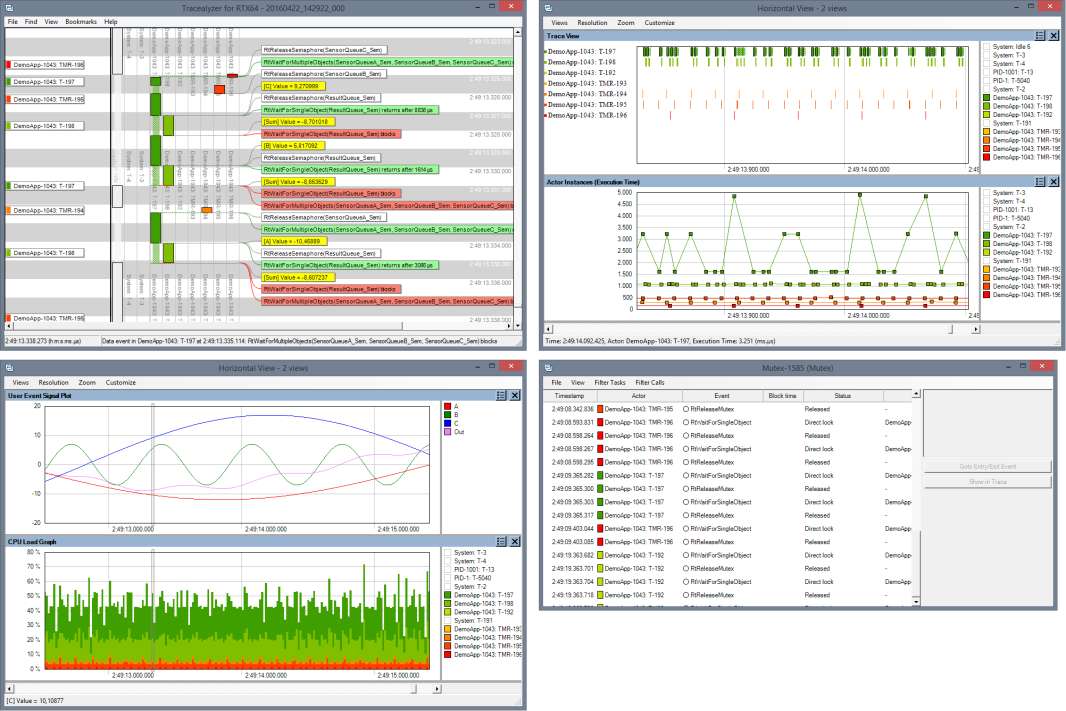
A few of the data views available in Tracealyzer
Tracealyzer contains several advanced analysis that help you to quickly comprehend the trace data. For instance, it connects related events, which allows you to follow activity between threads and to find the event that triggers a particular actor instance. Moreover, it provides various higher-level views, such as the Communication Flow graph and the CPU Load graph, which make it easier to find anomalies in a trace.
Related Topics ABOUT TRACEALYZER:
- Terminology
- Understanding the Tracealyzer User Interface
- Configuring Tracealyzer
- Using Tracealyzer
- Tips, Tricks, and Notes
rELATED tOPICS ABOUT MONITORING:
