CPU Load Graph
The CPU Load Graph displays CPU usage over time, per actor and in total. By default, it shows all actors except the idle thread. The analysis divides the trace into a number of intervals (100 intervals by default). The CPU usage for an actor in an interval is the amount of CPU time used by the actor within this interval, divided by the length of the interval. For each interval, all actors executing in that interval will be drawn as rectangles stacked on top of each other. The height of each actor's rectangle represents the CPU usage for that actor in that time interval and the combined height is the total CPU usage for that interval.

The colored histogram segments in this graph are stacked. So the top of the leftmost bar (in dark green) appears to show a value of about 46% on they Y-axis, but it’s really 46-22 = 24%, because the bottom of the dark green segment is located at about 22%.
NOTE: Some of the view modes use a stacked display, while others contain lines that are not stacked but are overlaid one atop another.
Menu Options
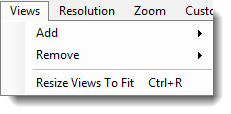
| Views Menu | Option | Description |
|---|---|---|
|
Add | Add a view to the current view. |
| Remove | Remove an existing view from the current view. | |
| Resize Views To Fit | Resizes all views to fit the current view window. | |
| Resolution Menu | Option | Description |

|
Very High - 200 High - 100 Medium - 50 Low - 25 Very Low - 10 Single - 1 |
Determines the number of intervals to display. For a more detailed graph, increase the number of intervals by selecting a higher resolution. |
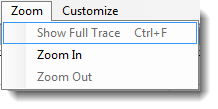
| Zoom Menu | Option | Description |
|
Show Full Trace | Displays the full trace in the current view. |
| Zoom In | Zooms in on the current view. To focus on a specific area, click and drag to select an interval. | |
| Zoom Out | Zooms out of the current view. To focus on a specific area, click and drag to select an interval. | |
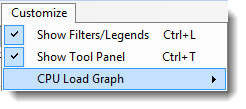
| Customize Menu | Option | Description |
|
Show Filters/Legends |
Toggles view of the actor view filters and legend.
|
| Show Tool Panel |
Toggles display of the Tool Panel.
|
|
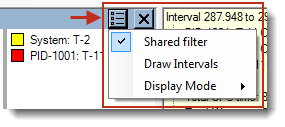
| Display Options | Description | |
|
Various options for customizing the display of the current view. Each view contains its own Display Options icon (shown at left are the display options for the CPU Load Graph view) . Note that the options available from this menu will vary depending on the graph/view. | |

To view information on an actor:
Click on an actor in the graph to display information about that actor in the selected interval.
Double-click an actor to center the Trace View on the selected interval. A gray outlined rectangle shows the interval of the current trace view. Note that the outlined rectangle may be very narrow and appear as a line if the trace view is small.
NOTE: You can combine this view with other horizontal views by choosing Views > Add > (graph type).
Related Topics about the Tracealyzer User Interface:
Related Topics ABOUT TRACEALYZER:
- About Tracealyzer
- Terminology
- Understanding the Tracealyzer User Interface
- Configuring Tracealyzer
- Tips, Tricks, and Notes
rELATED tOPICS ABOUT MONITORING:
