Object List
The Object List (Views > Object List) displays all service calls for a specific object, or memory allocations (malloc/free) on a Heap object. This view is easiest to open by double-clicking on an event label, e.g., in the Vertical Trace View. Each line corresponds to an event - the actor making the call, the type of event and the status of the object.
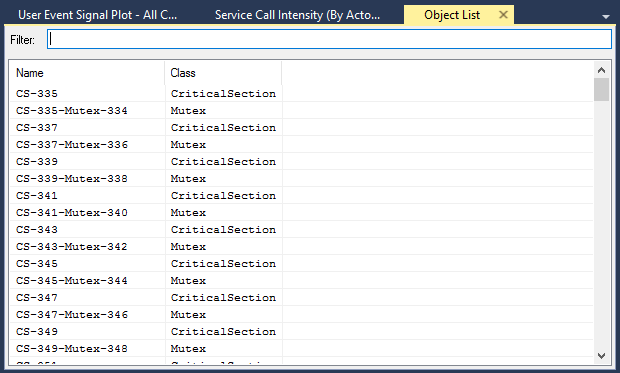
The event list can be filtered to only display events of a certain service or from a certain task, using the Filter menu. Clicking an event will display details about it in the panel to the right, which also features navigation buttons. Double-clicking an event will highlight it in the trace view.
When viewing heap events, such as "malloc" and "free", it is also possible to filter out all the allocations that have been freed, leaving only the remaining allocation. This can be used to find any memory leaks.
Related Topics ABOUT TRACEALYZER:
- About Tracealyzer
- Terminology
- Understanding the Tracealyzer User Interface
- Configuring Tracealyzer
- Tips, Tricks, and Notes
rELATED tOPICS ABOUT MONITORING:
