Object Utilization
The Object Utilization view (Views > Object Utilization) visualizes the state of objects over time. It can be used to identify situations where the system has trouble processing all input within a reasonable time.
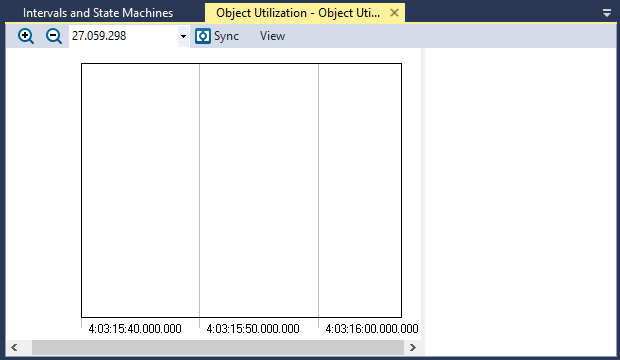
You can filter what actors to visualize by clicking on them in the legend field. If you click on a marker in the graph you can see information about that event in the information panel. Double-clicking will focus the main view on that event.
View Options
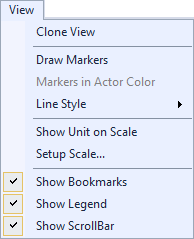
The View menu contains several options that allow you to change the graph’s display and content.
| Menu | Option | Description |
|---|---|---|
|
Clone View |
Creates a duplicate copy of the view in the same window. |
| Draw Markers |
Toggles display of markers. |
|
|
Markers in Actor Color |
Sets all markers to the actor color if Draw Markers is selected. |
|
| Line Style |
Choose a line style for the graph to display:
|
|
| Show Unit on Scale |
Toggles display of the units of measurement. |
|
| Setup Scale |
Opens the Setup Scale dialog, through which you can choose an automatic (default) or manual scale. |
|
| Show Bookmarks |
Toggles display of bookmarks |
|
| Show Legend |
Toggles display of the color legend. |
|
| Show ScrollBar |
Toggles display of the scrollbar. |
Related Topics ABOUT TRACEALYZER:
- About Tracealyzer
- Terminology
- Understanding the Tracealyzer User Interface
- Configuring Tracealyzer
- Tips, Tricks, and Notes
rELATED tOPICS ABOUT MONITORING:
