Running an RTSS Application that uses RTDLLs in the Debugger
wRTOS provides a Visual Studio integrated base debugger and launch provider that Visual Studio uses when debugging Real-time applications. RTSS applications are started by the wRTOS loader instead of the Windows loader. For this reason, when debugging RTSS applications in Visual Studio, conditional breakpoints and the following options in the Debug pull-down menu (which would assume Windows control) are not supported:
- Attach to Process
- Detach All
Note: The MaxRT wRTOS Debugger supports relative pathnames.
Note: The MaxRT wRTOS Debugger does not support loading RTDLL files that have pathnames containing Unicode characters with code points greater than 255. Unsupported characters include all Japanese, Chinese, Greek, Hebrew, Cyrillic, and Korean characters, as well as characters from many other non-Latin languages. The only supported characters are ASCII and ISO Latin-1 (ISO/IEC 8859-1), which includes characters with Unicode code points between 128 and 255, such as 'µ', 'ö', 'é', 'ß', 'ñ', 'ç'.
Build Configurations
Four configurations for creating DLLs are generated in Visual Studio when you create a project using the wRTOS RTDLL template:
x64
- RTSSDebug – Real-time DLL that has debug flags enabled
- RTSSRelease – Optimized Real-time DLL that does not include additional debug information
- Debug – Windows 64-bit DLL linked to wRTOS that has debug flags enabled
- Release – Windows 64-bit DLL linked to wRTOS
Note: We recommend that you select the RTSSDebug configuration of the application you want to debug, as this configuration is set up to generate debug information.
Set Debugging Properties
Optionally, you can set debugging properties for the application you want to debug. You can:
- Set the ideal processor on which the main thread of the debugged process will run.
- Set the affinity mask that specifies the processor(s) on which the debugged process will run.
See Setting Debugging Properties in Visual Studio for more information.
Debugging
To debug an RTDLL, you must now have a solution with two projects: a project that will create an RTDLL and a project that will create an RTSS process that will use the RTDLL. The program that will use the DLL should start when debugging begins.
Note: Data breakpoints are not supported.
To debug a program and RTDLL:
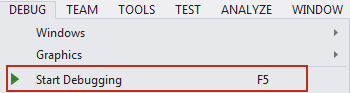
- To start debugging, select Start Debugging from the Debug pull-down menu, or press the F5 key.
- If you get a message asking if you would like to rebuild the SampleRTDLL, click No. A rebuild is not necessary since there were no changes since the previous build.
- At the first breakpoint, click Modules at the bottom of the window. If symbols are not loaded for either of the modules, right-click and select Load Symbols from the pull-down menu.
Note: If Modules are not available from the status bar at the bottom of the window, select Modules from the Windows option in the Debug pull-down menu to open the modules window.
- If necessary, locate the symbol file in the RTSS directory where the binaries were built.
The Output window should now indicate that symbols are loaded.
- To continue from the first breakpoint, select Continue from the Debug pull-down menu or press the F5 key.
- When the debugger stops at the second breakpoint, if this is the call to the toggle function, select Step Into or press the F11 key to step into the DLL function.
Focus will now turn to the SampleRTDLL.c source code.
- To continue, select Step Out from the Debug pull-down menu or press Shift+F11.
When focus returns to the SampleRTDLL.c program, you can select Continue or Stop Debugging from the Debug pull-down menu. If you select Continue, program execution will continue until it is completed or reaches another breakpoint. If you select Stop, program execution will halt.
For a more comprehensive example of debugging an RTDLL, see MiniTutorial: Debugging Applications in Visual Studio.