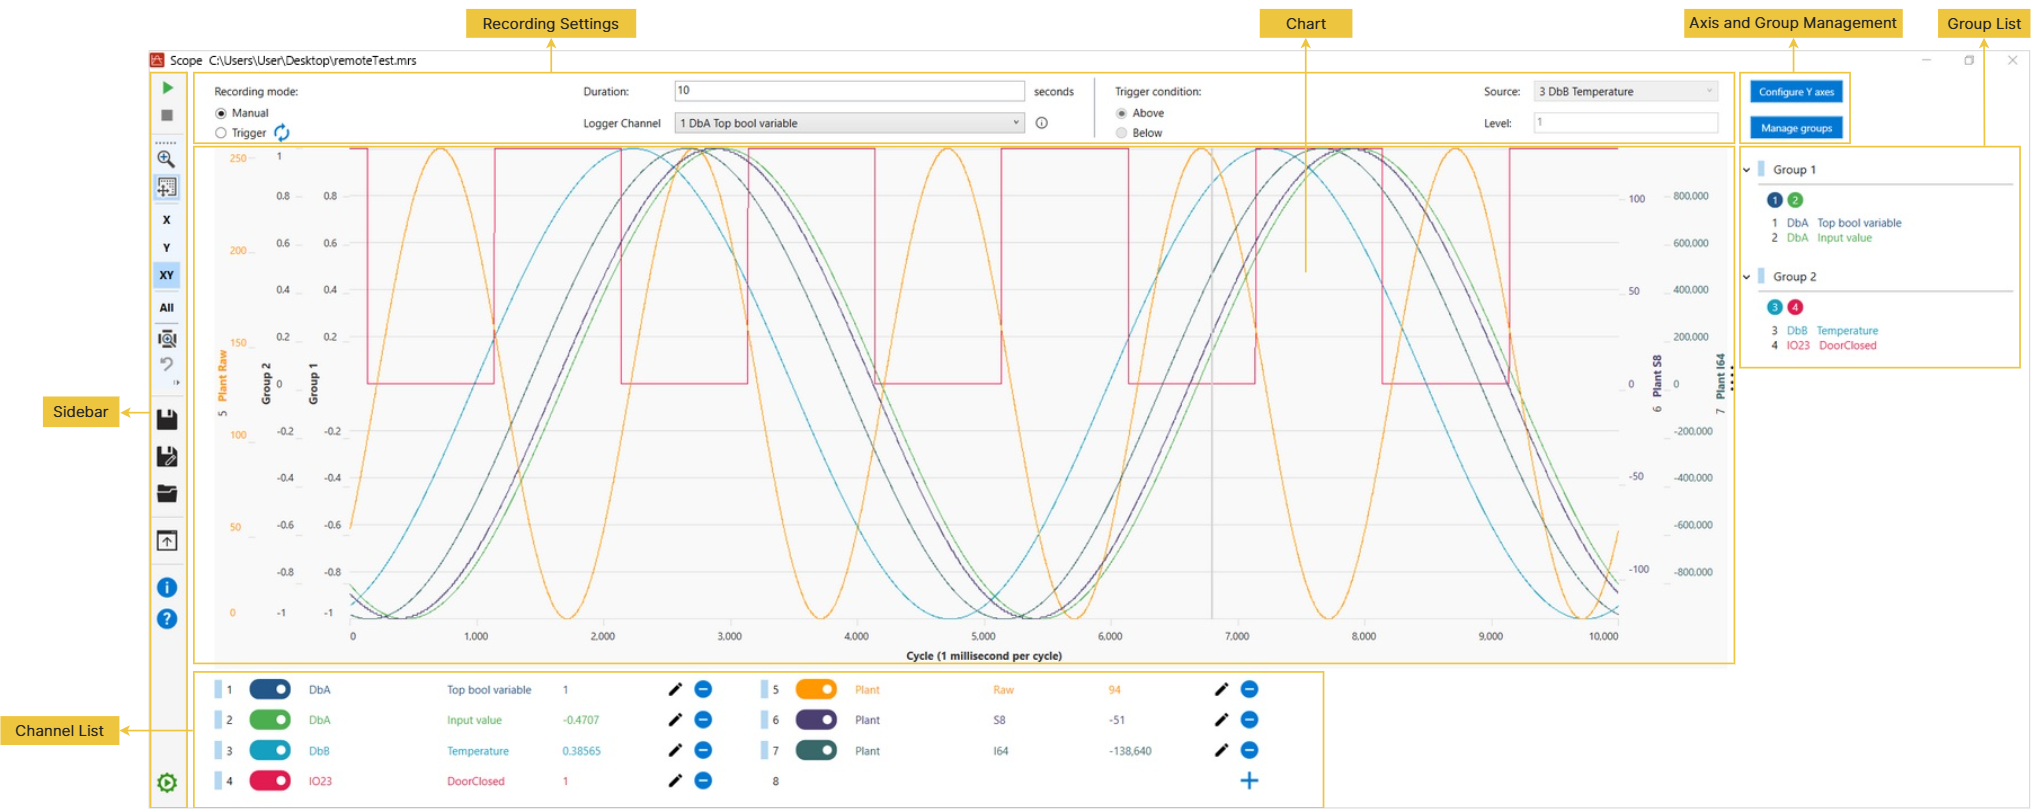
This section provides information about the Scope user interface.
Sidebar
Function buttons and icons on the Sidebar:
| Button / Icon | Name | Action |
|---|---|---|
|
|
Start recording |
Click to record channel data and display it in the Chart field. This button is available when the Subsystem is started, at least one channel has been added, and the recording and trigger settings contain no input errors. |
|
|
Stop recording |
Click to stop recording. |
|
|
Zoom to selection |
Click this button, then drag the mouse to draw a rectangle in the chart and zoom in on the selected area. You can repeat this action multiple times. To revert a zoom action, right-click in the chart or click the Undo zoom/pan button. |
|
|
Pan |
Click to enable panning mode. You can then click and drag the chart area to navigate horizontally or vertically. To revert a pan action, right-click in the chart or click the Undo zoom/pan button. |
|
X |
Mouse wheel zoom on X direction |
Click to restrict mouse wheel zooming to the horizontal X-axis, adjusting the visible time scale without changing the scales of the Y-axes. |
|
Y |
Mouse wheel zoom on Y direction |
Click to restrict mouse wheel zooming to the vertical Y-axes, adjusting the scales of the data series without changing the X-axis time scale. |
|
XY |
Mouse wheel zoom on XY direction |
Click to enable simultaneous zooming of both the X-axis and Y-axes when using the mouse wheel, adjusting both the time scale and the data series scales. |
|
All |
Target Y-axis for zoom/pan: All |
The default zoom and pan actions target the Y-axes of all channels. Depending on the selected channel or group, this icon displays All, a specific channel number (e.g.,
To select a channel or a group, click a channel in the Channel List or a group in the Group List. The Selection Indicator to the left side of the channel number or group becomes active. To deselect, click the channel or group again. Deselecting a channel or group restores the target to All. You can also double-click the Target Y-axis for zoom/pan button to restore the selection to All. Note: If the selected channel belongs to a group, selecting that channel also selects all channels in the same group. For more information about zooming or panning a specific channel or group, see Zooming and Panning the Y-Axis of a Channel or Group. |
|
|
Zoom to fit |
Click to reset the chart magnification and automatically scale the X-axis and Y-axis to fit the chart window. |
|
|
Undo zoom/pan |
Click to revert the last zoom or pan action. Up to 50 undo levels are supported. |
|
|
Save |
Click to save the current configurations to the project file path. |
|
|
Save as |
Click to save the current configurations to a new folder. |
|
|
Open Scope project |
Click to open a standard Open File dialog to load a project file (.mrs). This action is disabled while recording is active. |
|
|
Export data to CSV file |
Click to export data to a CSV file. The Export Data dialog appears when clicking this button. There are two options:
You must stop recording before exporting data. |
|
|
About |
Click to display tool information. |
|
|
Help |
Click to open the tool's Help. |
|
|
Real-time Subsystem status |
When wRTOS Scope is opened while the Subsystem is started, the Subsystem status icon is displayed in green, and the tool continuously monitors the Subsystem execution state. If the Subsystem stops or enters an error state, the icon turns gray. |


 ), or a group identifier (e.g., G2). The target axis for these operations is determined by selecting X, Y, or XY. For example, if G2 and Y are selected, performing a zoom action only affects the Y-axes of the channels within Group 2. If Channel 6 and XY are selected, a pan action only applies to the X-axis and Y-axis of Channel 6.


Recording Settings
You can configure the recording settings in this section. For more information about recording variables, see Recording Variables.
| Setting | Description |
|---|---|
|
Recording mode |
Select a recording mode. There are two options:
|
|
Duration |
Specify the recording duration in seconds. The default value is 10 seconds. Valid values range from 1 to 120 seconds. |
|
Logger Channel |
List all available channels configured for logging. |
|
Trigger condition |
Available only when Trigger is selected in the Recording mode field. Configure the following settings:
|
 button to allow recording to be triggered repeatedly. Disable the Repeat button to trigger the recording only once. You can configure specific conditions in the Trigger condition field.
Chart
After clicking the Start recording button, the channel traces are displayed in the chart, allowing users to visually detect anomalies, spikes, or patterns in the data cycles.
For individual channels that are not grouped, each channel has its own Y-axis. Channels within the same group share a single Y-axis.
Note: When the log server associated with a channel variable stops running, if the channel is a logger channel, the chart stops updating. If the channel is not a logger channel, the displayed channel value remains unchanged.
Note: If the chart update rate cannot keep up with the rate at which log data is generated, the update interval automatically increases from 100 milliseconds to a maximum of 1.6 seconds.
Axis and Group Management
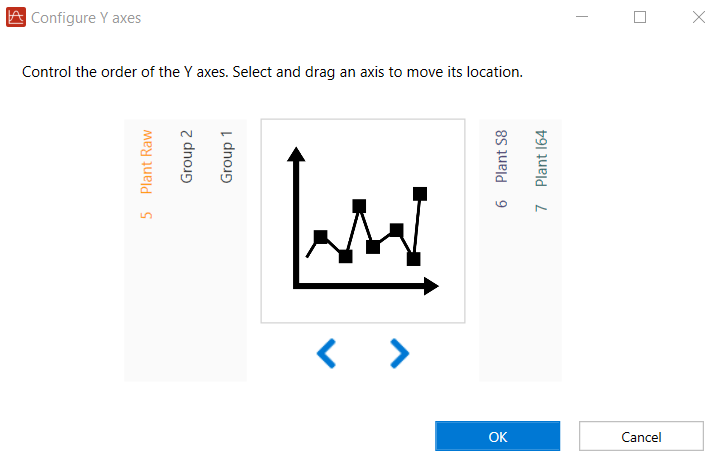
You can change the order of Y-axes and manage groups using the Configure Y axes and Manage groups buttons.
- Configure Y axes: Clicking this button opens a dialog that allows you to customize the layout of the chart area. This dialog displays a simulated view of the chart layout, flanked by the vertical axes representing your active channels and configured groups. To prioritize your visual analysis, you can modify the order of the vertical Y-axes. Select and drag any individual channel or group item horizontally to the left or right to rearrange its position relative to the central chart preview. Changes are applied immediately to the main chart display upon clicking OK.
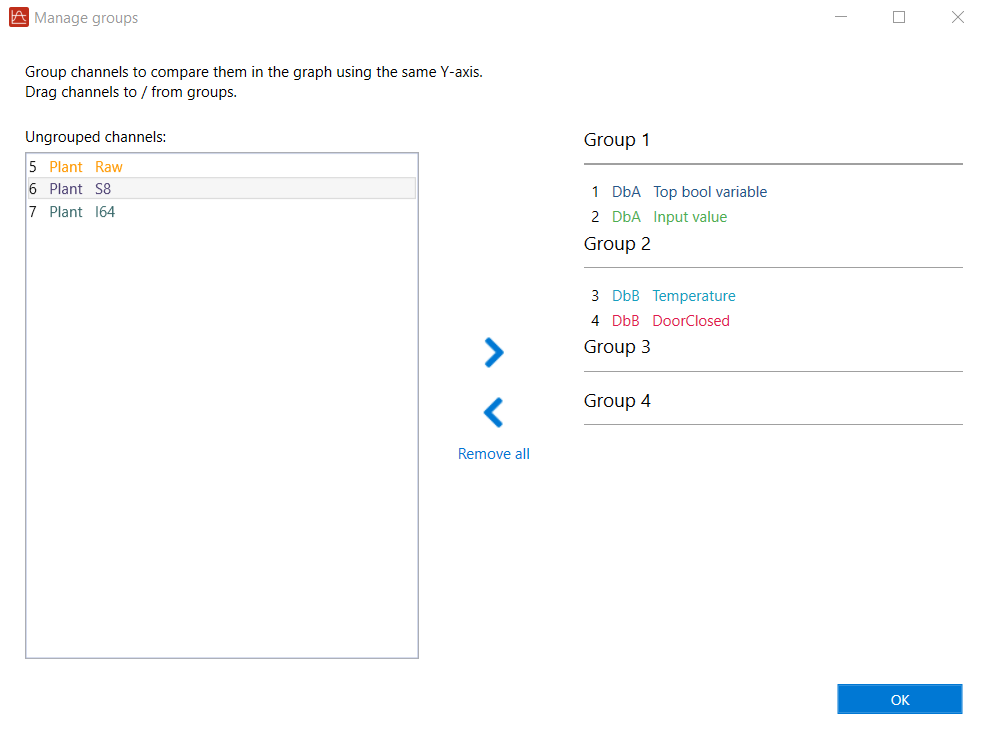
- Manage groups: Clicking this button opens a dialog that allows you to manage channel groups. You can add a channel to a group by dragging it from the Ungrouped channels field and dropping it to a specific group. Similarly, you can drag and drop channels between different groups. To remove a channel from a group, drag the channel and drop it back to the Ungrouped channels field. You can also use the <, >, and Remove all buttons to move or clear channels. After clicking OK. The configured channel groups are displayed in the Group List. For more details, see Adding Channels to a Group.
Channel List
The Channel List provides eight channels for adding variables from the Variable Database library. For more information about adding variables, see Adding a Variable to a Channel.
The channel name consists of the parent database or directory name, followed by the variable name or the custom display name (if configured).
When you hover the mouse pointer over the chart, a vertical cursor indicates the variable values. These values are also displayed to the right of each variable name in the Channel List.
Function buttons in the Channel List:
| Button | Name | Action |
|---|---|---|
|
|
Add |
Click to add a variable to the channel. This button is enabled when the Subsystem is started, and recording is stopped. For more information about adding variables, see Adding a Variable to a Channel. |
|
|
Delete |
Click to remove the variable from the channel. This button is enabled when the Subsystem is started, and recording is stopped. |
|
|
Edit |
Click to edit the channel. This button is enabled when the Subsystem is started, and recording is stopped. |
|
|
Selection Indicator |
Select a channel to perform zoom or pan actions. Click a channel to select it. The Selection Indicator becomes active. To deselect the channel, click it again. Note: If the selected channel belongs to a group, selecting that channel also selects all channels in the same group. |
|
|
Show/Hide Trace |
Toggle the switch to show or hide the channel trace in the chart. |


Group List
The Group List displays the grouped channels. This is useful when you want to check different variables within a database or compare identical variables from different databases. There are two ways to group channels:
- Use the Add to group setting in the Add Channel dialog (see Adding a Variable to a Channel).
- Use the Manage groups button (see Adding Channels to a Group).
After configuring groups, you can perform the following actions within the Group List:
- Click a channel number to show or hide its corresponding channel trace in the chart.
- Click a group to select it. When selected, the Selection Indicator to the left of the group name becomes active, and all channels within that group are selected simultaneously. You can then use the function buttons on the Sidebar to control the chart view, such as scrolling the mouse wheel to zoom the Y-axes for all channels in the group. To deselect the group, click it again.
Related topics: