Opening a Monitoring Session
Tracealyzer requires a monitoring session folder output by the RTX64 Monitor tool, or by using RtMonitorControl to enable monitoring programmatically.
If the RTX64 Runtime is not installed on the same system as the RTX64 SDK, you must copy the monitoring session folders from a system with the Runtime installed and then place these folders anywhere on the SDK system.
On systems with the RTX64 Runtime installed, monitoring session folders are created by the Runtime in %PUBLIC%\Documents\IntervalZero\Monitor by default. Session folder names include the date and time at which the monitoring session started in the form YYYYMMDD_HHMMSS_NNN, where NNN counts the number of sessions started within a given second.
NOTE: When you upgrade RTX64 on a machine that contains monitoring session data from RTX64 3.0, the default monitoring session folder is %PROGRAMDATA%\IntervalZero\Monitor.
Opening a Session
Once you have generated a monitoring session folder on—or copied one to—the machine running Tracealyzer, you can open the monitoring session by following the steps below.
To open a monitoring session:
- Click File > Open Folder. The Browse For Folder dialog appears.
- Browse for and select the monitor session folder you want to open. For example,
20160428_135227_000-MutexEvents.
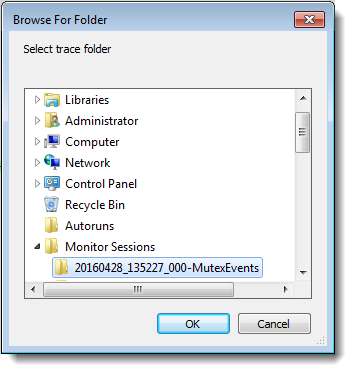
- Click OK. The session data appears in the Trace View.
Working with the Initial View
When a monitoring session folder is opened, Tracealyzer displays the full, high-level view of the session, which is typically too broad to provide a useful view of the data you are interested in. You can use the zooming and navigating options to target a specific area of the session data to analyze.
Related Topics ABOUT TRACEALYZER:
- About Tracealyzer
- Terminology
- Understanding the Tracealyzer User Interface
- Configuring Tracealyzer
- Using Tracealyzer
- Tips, Tricks, and Notes
rELATED tOPICS ABOUT MONITORING:
