Trace View
Trace View is the primary Tracealyzer view. It displays all recorded information on a vertical time line. This view is complemented by over 20 additional views providing high level overviews or focused views from different perspectives. These additional views are available from the View menu. The scheduling is presented using color coded rectangles, where the color helps to identify the actor (thread). The actor colors are taken from a color scheme based on the actor priority. The default color scheme is the natural light spectrum, going from red (high priority) to blue (low priority), and with lighter shades blue for the lowest priority threads and finally white for the idle thread. The exact colors used depends on the number of actors in the trace.

At the left side of this view are labels showing actor names. During a zoom out, the name labels are filtered so that only the most important labels are shown. Repeated labels of the same actor are then hidden and replaced by labels for less frequent actors. However, there is always at least one label per visible actor. You can click in the trace to display the corresponding actor name label.
View Modes
The execution of threads and interrupts can be visualized using three view modes, which you can quickly toggle between to optimize the display depending on the situation. The available view modes are:
- Gantt View Mode – shows one column per thread and interrupt. This is the preferred view mode for spotting rare actor instances and for visualizing periodic behavior This is the default visualization mode. (Shortcut Key "G").
- Gantt/CPU View Mode – switches the Trace View to Gantt/CPU View Mode. This view is the same as Gantt View Mode, except that each CPU (and its actors) is displayed separately. Note that this view mode is only available when there are multiple cores in the monitoring trace.
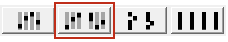
- Merged View Mode – shows all threads and interrupts in a single column, with sideways indents to show preemption and blocking. This gives the best sense of execution order. (Shortcut Key "M")
- Flat View Mode – shows what is executing on each core with no indents. This is the most compact mode. (Shortcut Key "F")
Events
The Trace View also shows event labels for kernel notices, kernel service calls and user events. Use the visibility filter in the lower right of the window to control display of these labels. The events are shown as color-coded labels to the right of the fragment in which they occur. Events can be selected by mouse clicks, which highlights the selected event using a blue glow. Double-click on an event to display the Kernel Object History or the User Event Log (depending on event type).
NOTE: If there are too many events in the current view to fit on the screen, they will be hidden and replaced by the message X events not shown. When this happens, zoom in or use the visibility filter to reduce the number of events.
NOTE: The events of the selected actor instance are always displayed.
Events are shown in different colors depending on type and status. See Understanding Labels for more information.
When selecting an event of a call that blocks, the corresponding event where that call returns or times out is also highlighted. Press F8 or use the context menu to jump to that event.
Advanced Features
Tracealyzer can identify activation causes for actor instances. For example, an instance might be activated when another actor signals a semaphore. To go to the activation cause of the selected actor instance, press F9.
Tracealyzer can also identify instances triggered by the selected instance, either from the Actor Information display ("Triggers") or via the F10 key. When you press F10 and there are multiple instances activated by the selected instance, a menu appears, through which you can select which activated actor you wish to follow.
For kernel service calls, press the F11 key to go to the sending or receiving event. When you press F11 on a semaphore, a RtWaitForSingleObjectEx Returned or RtWaitForMultipleObjectsEx Returned event would take you to the corresponding RtReleaseSemaphore event.
Related Topics about the Tracealyzer User Interface:
- Menu Options
- Tool Panel
- Finder Window
- Horizontal Trace View
- CPU Load Graph
- Scheduling Intensity
- Kernel Service Call Intensity
- Kernel Call Block Time
- Actor Instance Graphs
- Communication Flow
- Statistics Report
- User Event Log
- User Event Signal Plot
- Kernel Object History Viewer
- Heap Utilization
- Event Log
Related Topics ABOUT TRACEALYZER:
- About Tracealyzer
- Terminology
- Understanding the Tracealyzer User Interface
- Configuring Tracealyzer
- Tips, Tricks, and Notes
rELATED tOPICS ABOUT MONITORING:
