Raw Monitoring Framework Events
Raw Monitoring Framework Events are detailed, low-level events that contain data from the RTSS Subsystem. Raw Events contain additional data that Tracealyzer normally abstracts away, such as low level handles and pointers. Each Raw Event starts with a Time Stamp Counter value obtained via the RDTSC instruction at the time the event was generated.
NOTE: The text in a Raw Event matches the textual output from the RTX64 Monitor utility.
By default, Raw Monitoring Framework Events are included in the trace and displayed in the Trace View.
IMPORTANT! Including raw events may significantly increase memory usage and loading time.
To enable/disable Raw Events:
- Click File > Settings. The Settings dialog appears.
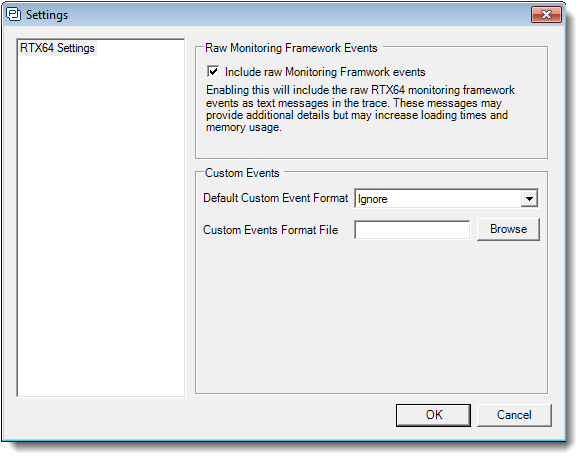
- To turn off inclusion of Raw Events, clear the selection in the Include raw Monitoring Framework events check box. To include them again, select the check box.
- Click OK.
NOTE: If this setting is changed while a session is open, you must close and reopen the session in order for the new Raw Events behavior to take effect.
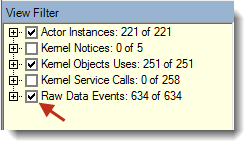
To toggle display of Raw Events:
- Ensure that Raw Events are included in the trace (see above).
- In the View Filter tree, select the Raw Data Events check box. To hide Raw Events, clear the selection of this check box.
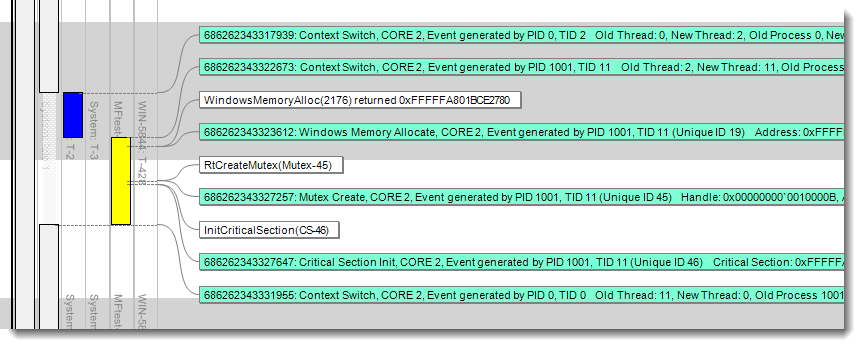
Raw Events are indicated by a teal color in the Trace View, as well as in the Event Log.
| The color... | Indicates... |
|---|---|
| Teal |
Raw Monitoring events. NOTE: Raw Events are included by default. You can disable Raw Events through the Settings dialog (File > Settings). |
NOTE:
When Trace View is in Gantt/CPU View Mode, Raw Events can extend beyond the viewable area, hiding CPUs and their actors and events. When this happens, you can use the horizontal scroll bar at the bottom of the Trace View to bring those CPUs into view.
Related Topics ABOUT TRACEALYZER:
- About Tracealyzer
- Terminology
- Understanding the Tracealyzer User Interface
- Configuring Tracealyzer
- Using Tracealyzer
- Tips, Tricks, and Notes
rELATED tOPICS ABOUT MONITORING:
