Statistics Report
The statistics report generator allows you to generate a high-level report on timing properties and CPU usage for the whole trace (if no selection exists in the main trace view), or the selected interval. The report can be saved as HTML, which allows you to store it for future reference, e.g., to compare timing and CPU load between different versions of your system.
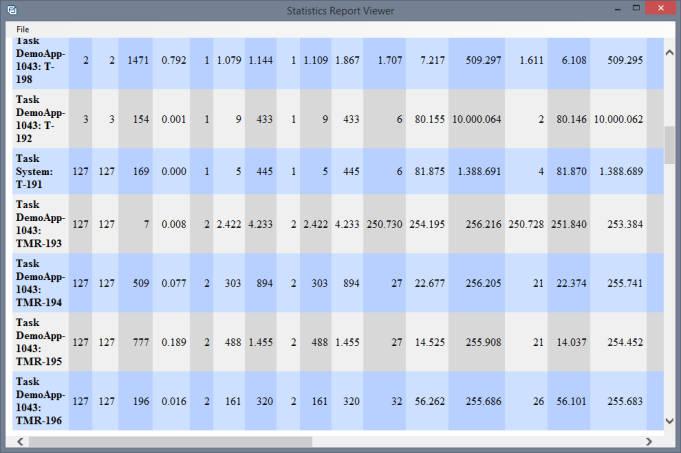
When you launch the Statistics Report, a configuration dialog is shown through which you can select which actors and properties you wish to include in the report. When you are done, click the Show Report button to view the report. The report has two sections, a table presenting a summary, and (optionally) a set of histograms showing the detailed distributions. Histograms are only included if the check box Show Graphical Diagrams is enabled.
The Histogram shows you one or several bars, where each bar shows:
- The interval represented by the bar (the X axis values)
- The percentage of actor instances within this interval (the Y axis values)
- The absolute number of instances within this interval (the floating value above the bar

Note that a bar may represent a single actor instance in some cases. In such cases, only the single value is shown on the x axis, instead of interval bounds. Also note that two adjacent bars may hide empty space in the underlying density distribution. That is, there may be an interval with no matching actor instances in between them.
The histogram bars and most fields in the table are linked to the Finder dialog. For instance, the areas indicated in red in the above illustration. The table value and the histogram bar both represent the highest found response time of a certain thread. When either of these is clicked, the Finder dialog opens and the actor filter is adjusted to find this specific case. The Finder will then show the match in the main trace window.
Related Topics about the Tracealyzer User Interface:
Related Topics ABOUT TRACEALYZER:
- About Tracealyzer
- Terminology
- Understanding the Tracealyzer User Interface
- Configuring Tracealyzer
- Tips, Tricks, and Notes
rELATED tOPICS ABOUT MONITORING:
