Menu Options
File Menu
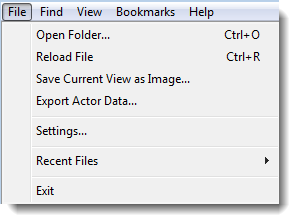
The File menu contains options for opening traces and exporting views and actor data:
| Menu | Option | Description |
|---|---|---|
|
Open Folder | Choose a monitoring session to open and analyze. |
| Reload File | Reloads the current session. | |
| Save Current View as Image | Exports the current trace view to an image. | |
| Export Actor Data | Exports actor instance data to a text file. The exported data includes start time, execution time, response time and fragmentation of each instance of the selected actors. You can export it as tab separated fields for import in other tools or space aligned columns for easy reading. | |
| Settings |
Launches the Settings dialog through which you can configure Tracealyzer settings. See Configuring Tracealyzer for more information. |
|
| Recent Files | Displays a list of recently opened session folders. | |
| Exit | Exits the program. |
Find Menu
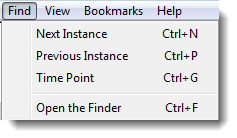
The Find menu allows you to quickly find the previous or next instance from the selected instance. You can also open the Finder dialog from this menu, or by pressing CTRL+F.
| Menu | Option | Description |
|---|---|---|
|
Next Instance |
Jumps to the next instance from the selected instance. NOTE: This option is grayed-out until an instance is selected. |
| Previous Instance |
Jumps to the previous instance from the selected instance. NOTE: This option is grayed-out until an instance is selected. |
|
| Time Point | Opens the Finder window, through which you can specify a time point to jump to. | |
| Open the Finder |
Opens the Finder window. For information on the features available from this menu, see Finder Window. |
View Menu
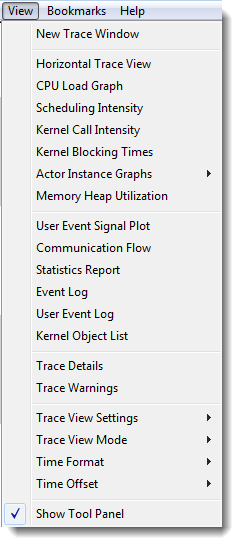
The View menu allows you to configure the trace view and to open other views. See the respective page for information about the other views.
| Menu | Option | Description |
|---|---|---|
|
New Trace Window |
Opens a new Trace View window. |
| Horizontal Trace View |
Opens the Horizontal Trace View. |
|
| CPU Load Graph |
Opens the CPU Load Graph. |
|
| Scheduling Intensity |
Opens the Scheduling Intensity graph. |
|
| Kernel Call Intensity | Opens the Kernel Call Intensity graph. | |
| Kernel Blocking Times |
Opens the Kernel Service Call Block Times By Service view. |
|
| Actor Instance Graphs |
Choose an Actor Instance graph. |
|
| Memory Heap Utilization |
Opens the Memory Heap Utilization graph. |
|
| User Event Signal Plot |
Opens the User Event Signal Plot graph. |
|
| Communication Flow |
Opens the Communication Flow view. |
|
| Statistics Report |
Opens the Statistics Report dialog. |
|
| Event Log |
Opens the Event Log. |
|
| User Event Log | Opens the User Event Log. | |
| Kernel Object List |
Opens the Kernel Object List. |
|
| Trace Details | Opens the Trace Details window, which displays session-related properties of the current trace, such as the number of events and the length of the trace, as well as additional technical details. | |
| Trace Warnings | Opens the Trace Warnings window. | |
| Trace View Settings | This submenu contains options for configuring the color scheme and toggling the display of bookmarks. | |
| Trace View Mode |
Choose a View Mode. |
|
| Time Format |
Choose a Time Format from the available options:
|
|
| Time Offset |
Choose a Time Offset from the available options:
|
|
| Show Tool Panel |
Toggles the display of the Tool Panel. |
Bookmarks Menu
The Bookmarks menu options allow you to create, organize, export and import bookmarks. All of the bookmarks you create are displayed in this menu. For more information, see Creating and Managing Bookmarks.
| Menu | Option | Description |
|---|---|---|

|
Add Bookmark | Opens the Add Bookmark window. |
| Organize Bookmarks | Opens the Bookmark Organizer window. | |
| Export Bookmarks |
Opens the Save As dialog, through which you can save existing bookmarks to a bookmark file ( |
|
| Import Bookmarks |
Opens the Open dialog, through which you can open bookmark files ( |
|
| Current Bookmarks |
All current bookmarks are listed at the bottom of the Bookmarks menu. For example, bookmark 619.353. |
Help Menu
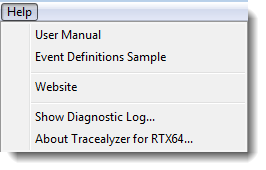
The Help menu includes the product documentation, a sample custom event definitions file, and diagnostic information about the application.
| Menu | Option | Description |
|---|---|---|
|
User Manual | Launches the RTX64 SDK Help system, opened to the Tracealyzer section. |
| Event Definitions Sample |
Opens the Event Definitions Sample folder, which contains the See Creating Custom Definitions for more information. |
|
| Website | Launches percepio.com in the default Web browser. | |
| Show Diagnostic Log |
Opens a log file of the current trace in |
|
| About Tracealyzer for RTX64 |
Displays the About window, which contains information specific to the current version and build of Tracealyzer. |
Related Topics about the Tracealyzer User Interface:
Related Topics ABOUT TRACEALYZER:
- About Tracealyzer
- Terminology
- Understanding the Tracealyzer User Interface
- Configuring Tracealyzer
- Tips, Tricks, and Notes
rELATED tOPICS ABOUT MONITORING:
