Finder Window
The Finder window lets you quickly find actor instances, kernel service calls and user events, using various filters. The Finder also lets you jump to a particular point in time.
Actor Instances Tab
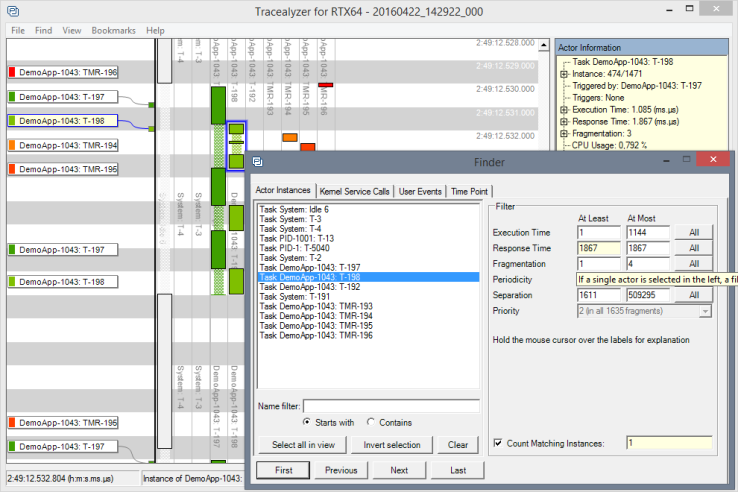
The Actor Instances tab lets you find and follow actor instances matching various search criteria.
To the left is a list of actors in the trace where you can select which actors you want to find instances of. Use Ctrl+Select to select multiple actors. When one or more actors are selected, the navigation buttons are enabled.
The filter is enabled when a single actor is selected. Only instances where the values are between the At Least and At Most are included in a search. By default, the boxes contain the lowest and highest value of all instances, so that all instances are included.
NOTE: The filter is not available when multiple actors are selected.
Kernel Service Calls Tab
The Kernel Service Calls tab lets you find Kernel Service Call Events filtered by the actor in which they occur, the referenced kernel object, and the called service.
The Tree view allows you to select the elements you are interested in. Only calls by an actor selected in the tree view will be included in the search. By default all actors are selected. You must select an object or a service to get any matches. If one or more objects is selected, all calls manipulating a selected object will be matched. If you instead select one or more services, any call to a selected service will be matched. If you select both one or more objects and one or more services, only calls to a selected service manipulating a selected object will be matched.
Use the check boxes to further limit matched calls by only including blocking calls, non-blocking calls, and/or timeouts.
User Events Tab
The User Events tab allows you to find user events. You can select which events you want to search for and in which actors you wish to search. Only events occurring in a selected actor will be included in the search.
Time Point Tab
The Time Point tab allows you to jump to a specific point in the trace. To do this, enter a timestamp and press Enter.
Related Topics about the Tracealyzer User Interface:
Related Topics ABOUT TRACEALYZER:
- About Tracealyzer
- Terminology
- Understanding the Tracealyzer User Interface
- Configuring Tracealyzer
- Tips, Tricks, and Notes
rELATED tOPICS ABOUT MONITORING:
