Kernel Object History Viewer
The Kernel Object History view appears whenever you double-click on a kernel object in the View Filter or Kernel Object List window. The Kernel Object History view displays all kernel service calls for a specific kernel object. This is displayed as a list that displays:
- The actor making the call
- The type of event
- The status of the kernel object
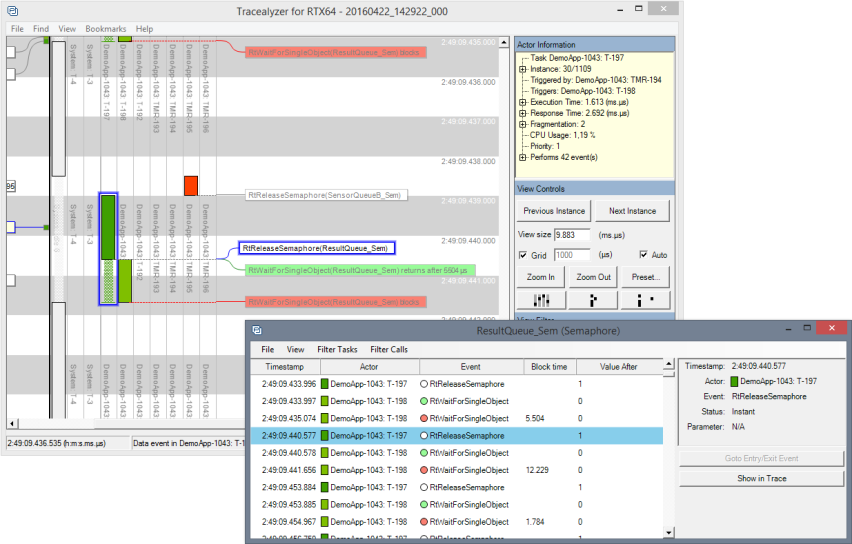
Use the Filter menus to filter the event list to only display events of a certain service or from a certain task. Clicking an event will display details about it in the panel to the right, which also features navigation buttons. Double clicking an event will highlight it in the trace view.
For heap objects, the view shows a list of allocation and release events. Each row contains this information:
- The address of the allocation
- The total heap usage after the event
- The usage change caused by the event
The view can be filtered to only show allocation events for which there are no matching release events. To enable this filter, use the Show Remaining Only option in the Filter Calls menu.
Related Topics about the Tracealyzer User Interface:
Related Topics ABOUT TRACEALYZER:
- About Tracealyzer
- Terminology
- Understanding the Tracealyzer User Interface
- Configuring Tracealyzer
- Tips, Tricks, and Notes
rELATED tOPICS ABOUT MONITORING:
