Tool Panel
The Tool Panel is located to the right of the Trace View in the Tracealyzer window. The Tool Panel contains these features:
| Tool Panel | Option | Description |
|---|---|---|
|
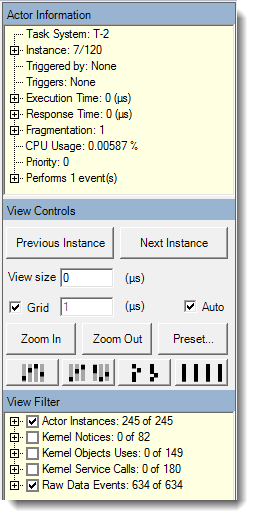
Actor Information |
Displays information about the selected actor and the currently selected actor instance, such as timing, fragmentation and any events that occur. Property values for the selected instance are displayed as well as actor average, maximum and minimum. |
| View Controls |
Contains options for navigating and zooming in/out of the session data in the Trace View. You can:
The number of button options will vary depending on the number of cores in the session. |
|
| View Filter |
Controls what is displayed in the Trace View. By default, all actors are visible and all events are hidden. Un-checking an actor causes its fragments to be drawn as outlined gray rectangles, but does not hide it completely. Any events in unchecked actors will be hidden. To display kernel service events, select one or more kernel services or kernel objects you are interested in. If you select both kernel objects and kernel services, the included events must match both a selected kernel service and a selected kernel object. The Kernel Objects Uses and Kernel Service Calls check boxes are an AND filter. Both the object and the service must be enabled in order for it to be displayed in the Trace View. Raw EventsBy default, Raw Monitoring Framework Events are included in the trace. However, including raw events may significantly increase memory usage and loading time. You can turn off display of raw events in the View Filter. To do this, clear the selection in the Raw Data Events check box. See Raw Monitoring Framework Events for more information. Custom EventsCustom monitoring events—shown as user events in Tracealyzer—are generated by the function RtGenerateEvent. In order to see these events in the Trace View you must turn on their display in the View Filter. To do this, select the User Events check box. See Defining Parsing Rules for Custom Events in Tracealyzer for information on defining the display of custom events. |
To show/hide the Tool Panel:
Use the View > Show Tool Panel option to toggle display of the Tool Panel.
Related Topics about the Tracealyzer User Interface:
- Menu Options
- Trace View
- Finder Window
- Horizontal Trace View
- CPU Load Graph
- Scheduling Intensity
- Kernel Service Call Intensity
- Kernel Call Block Time
- Actor Instance Graphs
- Communication Flow
- Statistics Report
- User Event Log
- User Event Signal Plot
- Kernel Object History Viewer
- Heap Utilization
- Event Log
Related Topics ABOUT TRACEALYZER:
- About Tracealyzer
- Terminology
- Understanding the Tracealyzer User Interface
- Configuring Tracealyzer
- Tips, Tricks, and Notes
rELATED tOPICS ABOUT MONITORING:
