Menu Options
Jump to a menu in this topic to view information on its options.
Menus:
File Menu
The File menu contains options for opening traces and exporting views and actor data:
| Menu | Option | Description |
|---|---|---|
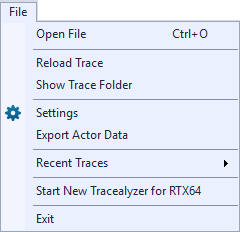 |
Open File | Choose a monitoring session file to open and analyze. |
| Reload Trace | Reloads the current session. | |
| Show Trace Folder | Shows the trace folder in the file system. | |
| Save Current View as Image | Exports the current trace view to an image. | |
| Settings |
Launches the Settings dialog through which you can configure Tracealyzer settings. See Configuring Tracealyzer for more information. |
|
| Export Actor Data | Exports actor instance data to a text file. The exported data includes start time, execution time, response time and fragmentation of each instance of the selected actors. You can export it as tab separated fields for import in other tools or space aligned columns for easy reading. | |
| Recent Traces | Displays a list of recently opened session folders. | |
| Exit | Exits the program. |
Find Menu
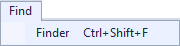
The Find menu allows you to quickly find the previous or next instance from the selected instance. You can also open the Finder dialog from this menu, or by pressing CTRL+F.
| Menu | Option | Description |
|---|---|---|
|
Finder |
Search the open session for actor instances, service calls and user events, or jump to a particular point in the session. For more information, see Using the Finder Window. |
View Menu
The View menu allows you to configure the trace view and to open other views. See the respective page for information about the other views.
| Menu | Option | Description |
|---|---|---|
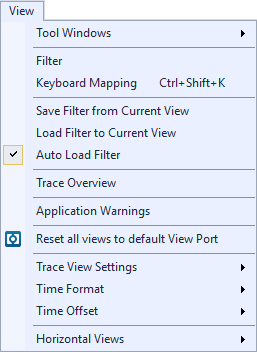 |
Tool Windows | Opens the Tool Windows window, which allows you to show/hide various windows. |
| Filter | Opens the Filter window, which allows you to determine what information should be displayed in the different views. | |
| Keyboard Mapping | Opens the Keyboard Mapping window, in which you can assign keyboard shortcuts to various actions. | |
| Save Filter from Current View | Saves the filter from the current view to an XML file. | |
| Load Filter to Current View | Load a saved filter (XML file) and apply it to the current view. | |
| Auto Load Filter | Auto-loads the most recent filter. | |
| Trace Overview | Opens the Trace Overview window. This window provides information on the open session, including the trace length, number of events, and bookmarks. It also includes a session timeline. | |
| Application Warnings | Opens the Application Warnings window, which displays all warnings with a corresponding timestamp for each. | |
| Reset all views to default View Port | Resets all open views to their default view. | |
| Trace View Settings | This submenu contains options for configuring the color scheme and toggling the display of bookmarks. | |
| Time Format |
Choose a Time Format from the available options:
|
|
| Time Offset |
Choose a Time Offset from the available options:
|
|
| Horizontal Views |
Configure settings for displaying information in horizontal views:
|
Layout Menu
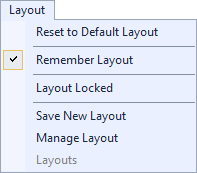
The Layout menu includes options that allow you manage the Tracealyzer layout.
| Menu | Option | Description |
|---|---|---|
|
Reset to Default Layout | Resets to the default layout. |
| Remember Layout | When enabled (default), Tracealyzer remembers the previously used layout and restores it as the default layout when started. | |
| Layout Locked | When enabled, views in the current layout cannot be rearranged. | |
| Save New Layout | Saves the current layout with a name you specify. | |
| Manage Layout | Rename or remove a saved layout. | |
| Layouts | Restore a previously saved layout. |
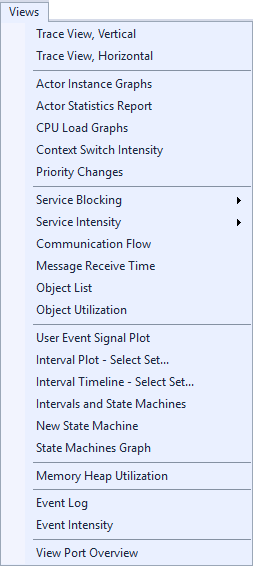
Views Menu
The Views menu includes options that allow you to open the various views available in Tracealyzer.
| Menu | Option | Description |
|---|---|---|
|
Trace View, Vertical |
Opens a new vertical Trace View window. This is the main view of Tracealyzer for RTX64, showing all recorded events. |
| Trace View, Horizontal |
Opens a new horizontal Trace View window. This is the main view of Tracealyzer for RTX64, showing all recorded events. |
|
| Actor Instance Graphs |
Opens the Actor Instance graphs, which display timing properties of actor instances, like execution time, response time, response interference and fragmentation. |
|
| Actor Statistics Report |
Opens the Actor Statistics Report dialog, which provides performance statistics for tasks and traced ISRs |
|
| CPU Load Graphs |
Opens the CPU Load Graphs, which display CPU usage over time |
|
|
Context Switch Intensity |
Opens the Context Switch Intensity graph, which shows the amount of context switches over time |
|
|
Priority Changes |
Displays changes to a task’s scheduling change priority. |
|
|
Service Blocking |
Opens the Service Call Block Time graph, which displays the kernel blocking times of service calls, i.e., the time between entry and return of blocking calls, for all objects or an object you specify. |
|
| Service Intensity |
Opens the Service Call Intensity graphs, which display the number of Service Calls over time. |
|
| Communication Flow |
Opens the Communication Flow graph, which offers a quick overview of the communication and synchronization between actors in a trace, through message queues, semaphores and mutexes. |
|
|
Message Receive Time |
Opens the Message Receive Time plot, which shows the message receive time, i.e., the time from a queue is put in a message queue, until it is received. This way, you can see if messages to a task are delayed. |
|
| Object List |
Opens the Object List, which shows all objects. |
|
|
Object Utilization |
Opens the Object Utilization view, which visualizes the state of objects over time, such as the number of messages in a message queue. |
|
| User Event Signal Plot |
Opens the User Event Signal Plot graph, which allows for plotting data from user events arguments. |
|
|
Interval Plot |
Opens the Interval Plot view, which plots the duration of intervals over time. This is ideal if you want to study how the distance in time between two important events varies. For more information on intervals, see Intervals and State Machines. |
|
|
Interval Timeline |
Opens the Interval Timeline view, through which you can plot state intervals over time. This effectively provides a software logic analyzer. For more information on intervals, see Intervals and State Machines. |
|
|
Intervals and State Machines |
Opens the Intervals and State Machines view, through which you can create intervals and state machines to visualize. |
|
|
New State Machine |
Opens the New State Machine dialog, through which you can either create a simple or advanced state machine. |
|
|
State Machines Graph |
Opens the State Machines Graph, which displays a directed graph showing the state transitions in the trace as defined by a state machine. |
|
| Memory Heap Utilization |
Opens the Memory Heap Utilization graph, which visualizes the heaps in the current trace. |
|
| Event Log |
Opens the Event Log, which displays the trace as a textual event listing, with powerful filtering tools. The view also supports exporting the trace as text file. |
|
|
Event Intensity |
Opens the Event Intensity graph, which displays the number of events per event type, during the selected interval. |
|
|
View Port Overview |
Opens the View Port Overview window, which shows the view ports that are used by any view.
|
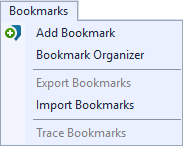
Bookmarks Menu
The Bookmarks menu options allow you to create, organize, export and import bookmarks. All of the bookmarks you create are displayed in this menu. For more information, see Creating and Managing Bookmarks.
| Menu | Option | Description |
|---|---|---|
|
Add Bookmark | Opens the Add Bookmark window. |
| Organize Bookmarks | Opens the Bookmark Organizer window. | |
| Export Bookmarks |
Opens the Save As dialog, through which you can save existing bookmarks to a bookmark file ( |
|
| Import Bookmarks |
Opens the Open dialog, through which you can open bookmark files ( |
|
| Trace Bookmarks |
Lists the bookmarks in the current session. For example, bookmark 619.353. |
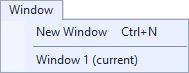
Window Menu
The Window menu includes the product documentation, a sample custom event definitions file, and diagnostic information about the application.
| Menu | Option | Description |
|---|---|---|
|
New Window | Opens a new Tracealyzer window. |
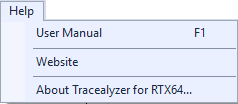
Help Menu
The Help menu includes the product documentation, a sample custom event definitions file, and diagnostic information about the application.
| Menu | Option | Description |
|---|---|---|
|
User Manual | Launches the RTX64 SDK Help system, opened to the Tracealyzer section. |
| Website |
Launches intervalzero.com in the default Web browser. |
|
| About Tracealyzer for RTX64 |
Displays the About window, which contains information specific to the current version and build of Tracealyzer.
|
Related Topics ABOUT TRACEALYZER:
- About Tracealyzer
- Terminology
- Understanding the Tracealyzer User Interface
- Configuring Tracealyzer
- Tips, Tricks, and Notes
rELATED tOPICS ABOUT MONITORING:
